2001issue C051-4
Earnback period ranking for growth-adjusted screens
The earnback period restates an earnings multiple at a stated constant growth rate as the years a firm needs to accumulate earnings equal to the current share price. Used as a screening overlay, that years-to-recover figure can rank names on a constant-earnback contour, with rotation or abstention only after a separate risk and growth-credibility check.
- The earnback period is the years a firm needs, at a stated constant earnings-growth rate, to accumulate earnings equal to the current share price; with zero growth it collapses to the ordinary earnings multiple.
- A multi-year average return on equity, or another credible historical earnings-growth rate, can supply the constant-growth input so names with different growth paths can be ranked together.
- A constant-earnback contour in earnings-multiple versus growth space places richer combinations above the curve and cheaper ones below it.
- A short earnback can reflect concentrated business risk rather than cheapness, so a rank-based rotation should wait for a risk and growth-credibility review.
What the earnback period measures
The earnback period is the number of years a firm with constant earnings growth needs to accumulate earnings equal to the current share price. With zero growth that quantity collapses to the ordinary earnings multiple.
The earnings multiple is price divided by a single period’s earnings. It does not adjust for differing growth paths when names are compared. Earnback generalizes the earnings multiple so names with different growth rates can be ranked together.
How years to recover are formed
Under constant growth, earnback equals the natural log of one plus growth times the earnings multiple, divided by the natural log of one plus the growth rate.
A sustainable growth input
A multi-year average return on equity can supply the growth input because it carries a financially sustainable rate. Other credible historical earnings-growth averages may replace it, and unsustainable estimates should be revised.
A scaled multiple is not years to recover
Scaling the earnings multiple by a growth percentage is an empirical shortcut with informal cheapness cutoffs. It is not a years-to-recover interpretation.
A constant-earnback contour
An earnback level of 9, near the sample median of 8.8 and mean of 9.4, traces a curve in earnings-multiple versus growth space. Richer combinations sit above the curve and cheaper ones sit below it.
A historical rank association
In the mid-1999 sample, the rank correlation of earnback with the following half-year return was -0.28, versus -0.10 for the earnings multiple, and only the earnback association was significant at 5%.
Rank, rotate, and review risk
Ordering names by increasing earnback treats shorter recoveries as cheaper candidates and longer recoveries as richer, subject to risk review. A short earnback can indicate concentrated business risk rather than cheapness, so a median- or mean-based split should be followed by a risk and growth-credibility review before any rank-based rotation.
Earnback ranking is a screening overlay rather than a mechanical allocation rule.
June 1999 earnback-period ranking, Helsinki sample
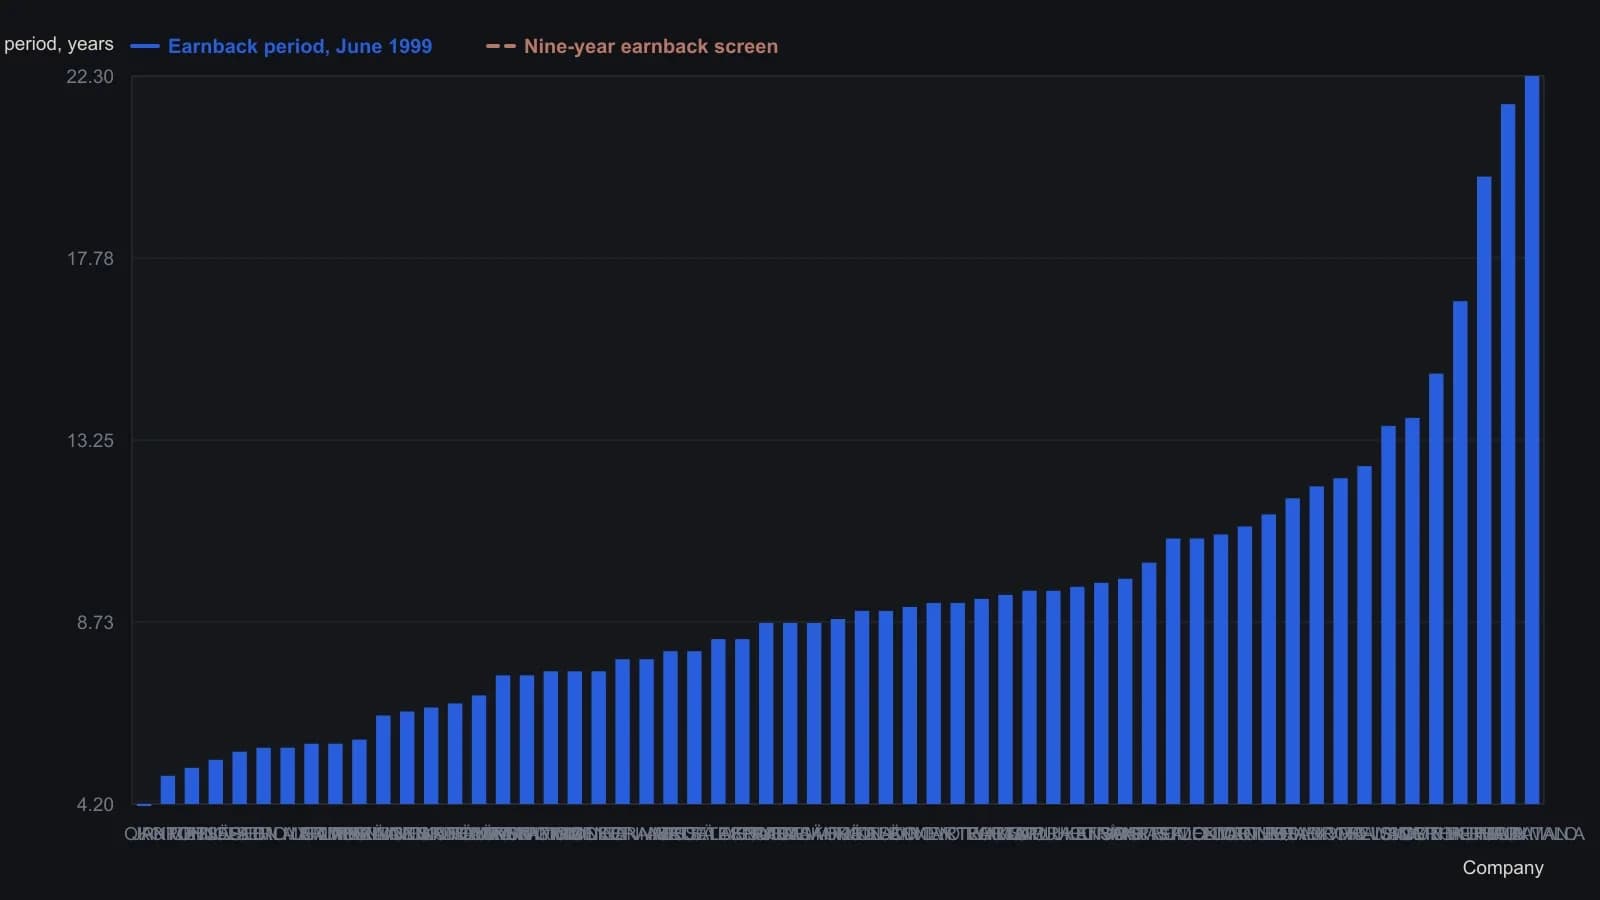
Expected growth is the five-year average return on equity, used as a financially sustainable rate. Nine years is the authors’ screen because it sits near the sample median of 8.8 and mean of 9.4. Subsequent six-month returns are reported in the same table but use a different unit, so they are not plotted.
All readings on this track · 16 readings
- 1988A two-rule classroom book of cheapness and new highs
- 1995A supermarket-chain case for yield, trendline, and a written checklist
- 1996Annual normalized-yield rank rotation for cyclical sleeves
- 1996Value filter then rank-rotate as one procedure
- 1997Dow high-yield rank rotation as a testable portfolio procedure
- 1998Low relative P/E plus a trendline reversal for regime-aware stock selection
- 1998Rank rotation, value screens, and ten-stock diversification
- 2001Earnback period ranking for growth-adjusted screens
- 2003Stress-testing calendar yield rotation in a declining tape
- 2003A value overlay and strangle hedge during a growth-led regime
- 2005Unfashionable value versus momentum in the book
- 2007Why premove fundamentals rarely flag tenfold-price moves
- 2012Year-end yield rank rotation with a collapse veto
- 2015A five-name January book from yield and price ranks
- 2017Screening value traps with regime-aware overlays
- 2017A pre-trade fail test for the cheap-looking name