1999issue C011-11
A surviving weekly gap still needs a confirmation-breakout
The archive keeps a weekly unfilled opening as a setup-bar, not as an automatic entry. The tactical-pattern is accepted only after a later confirmation-breakout reclaims the gap-week extreme.
- Short-horizon trading is framed as a calculated equity sacrifice that remains valid only when statistical, psychological, and logical checks still hold.
- Statistical-prey screening first removes bars later price action has overwritten, then tests only the surviving bars as candidate setups.
- The first upside weekly gap is described as a shakeout. The later reclaim of the gap-week high is the intended confirmation-breakout.
- A single optimized parameter is treated as an unreliable fit. Only a family of parameters that remains strong is inspected for psychological and logical confirmation.
A weekly gap is still a hypothesis
The archive frames short-horizon trading as a calculated equity sacrifice. That sacrifice is treated as valid only when the underlying statistical, psychological, and logical checks still hold.
A four-part validity check is specified. The setup needs a tested edge, an anticipation of crowd psychology, a logical reason it should work or fail, and a rule set simple enough to recognize and execute.
Editorial interpretation: apply those checks to the later confirmation, not to the first gap. The first unfilled opening becomes a setup-bar. The hypothesis waits for a later confirmation-breakout to support or reject that bar.
How statistical-prey screening narrows the field
Statistical-prey screening first removes bars later price action has overwritten. The remaining bars are treated as the only candidates worth testing for a repeatable condition.
A single optimized parameter is treated as an unreliable fit. Only a family of parameters that remains strong is then inspected for psychological and logical confirmation.
Editorial note: the screen is not there to decorate a chart. It keeps only those surviving bars that can still be turned into a falsifiable setup.
Soybean weekly-gap longs: running profit 1969-95
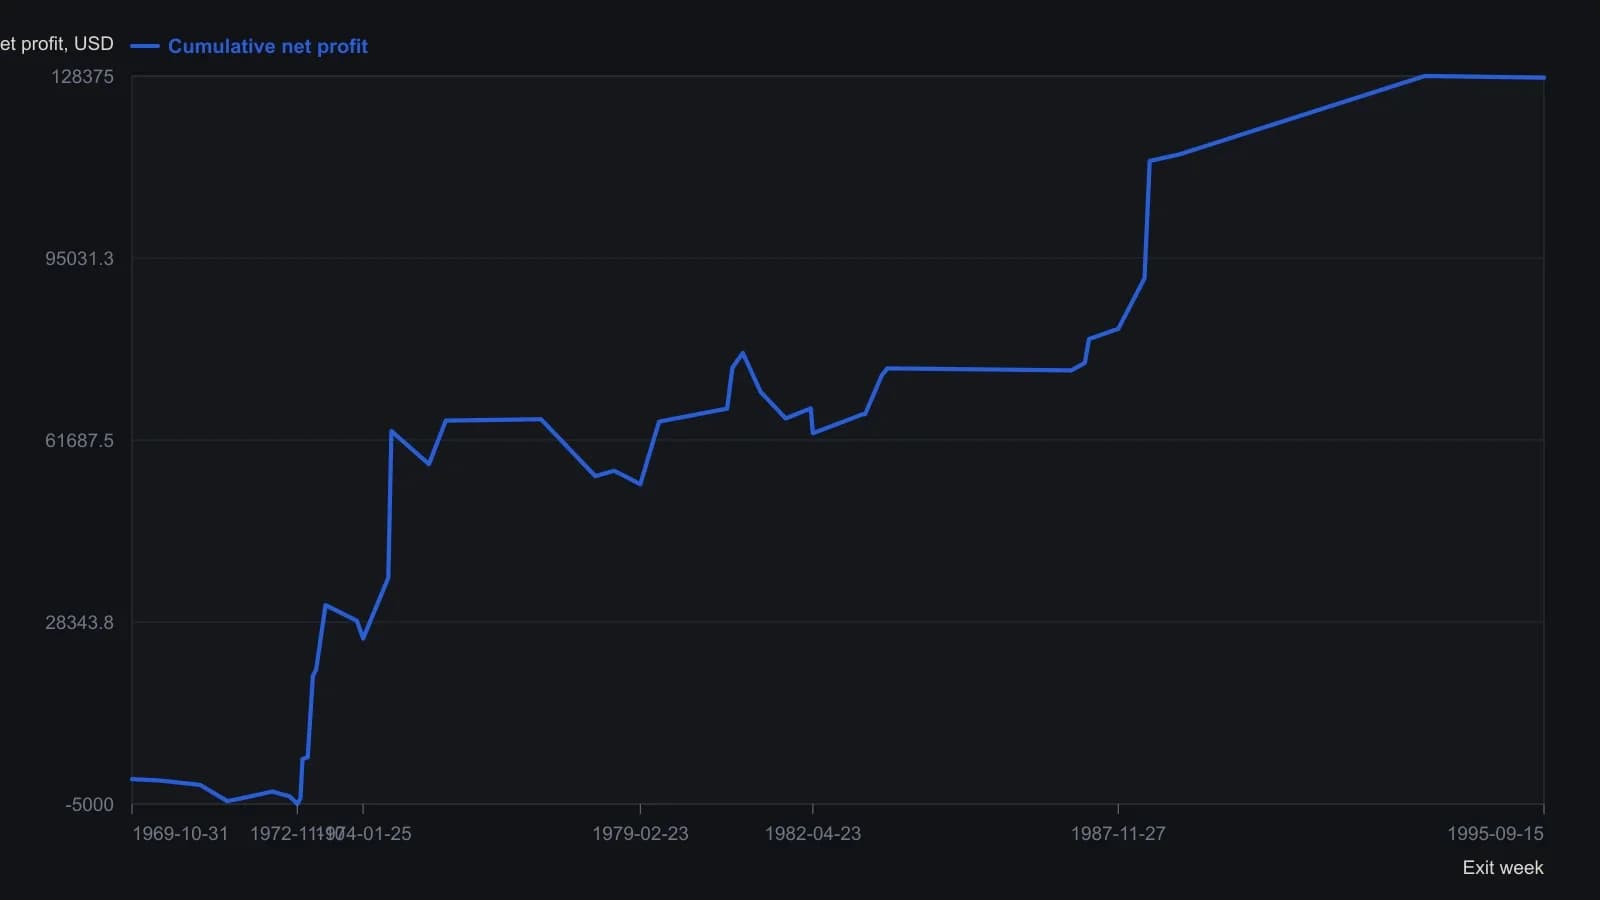
Weekly back-adjusted continuous soybeans, 2 Feb 1968 to 2 Aug 1996. Five contracts; $75 per contract commission and slippage; no protective stop; exit on the next week's opening. Longs only.
The gap-week sequence and confirmation-breakout
The soybean weekly-gap hypothesis is stated as a short weekly sequence. In week one, a gap-week opens above the prior week's high and leaves an unfilled opening gap. That bar is the setup-bar, and its high is the later reference.
In week two the market opens below that high and then exceeds it. That open-then-exceed sequence is the confirmation-breakout. The long specified by the hypothesis is closed on the next week's open.
The initial upside weekly gap is described as a shakeout, not an entry. The later reclaim of the gap-week high is the intended confirmation that stronger participation has returned.
The archive therefore treats the whole combination as a tactical-pattern. It accepts a defined equity sacrifice only when the later confirmation still validates the original calculation.
All readings on this track · 11 readings
- 1987Broken bias: stops, cash flow and unfilled gaps
- 1999A surviving weekly gap still needs a confirmation-breakout
- 2000Repeatable volume-price silhouettes as falsifiable hypotheses
- 2004Constructing pivot commonality across timeframes
- 2005A finished crude-oil top as a classroom for necklines, candles, and gaps
- 2007Journal a gap breakout as three sequential gates
- 2008Same-open kicker as a two-bar reversal case
- 2010Filtered gap follow-through entry rules
- 2010Cloudbank overhead resistance and breakout recovery
- 2015Post-exit cooldown as a system rule
- 2018Classifying chart gaps before fill or follow