2006issue C041-8
Constructing peak-excursion filters for stops and size
Peak excursion turns the larger open-to-high or open-to-low stretch into average inputs for stop distance, a pre-trade trend filter, and inverse position size.
- One-bar peak excursion is the larger of the high-minus-open and open-minus-low distances, divided by the open, and is the near-term unit of stretch.
- N-bar peak excursion compares a starting reference open with the window high and low, and a moving average of that stretch can bound stop distance.
- Alpha and the n-bar-to-lagged-one-bar ratio test whether a longer window is adding stretch, while inverse average peak excursion can reduce unit weight before the order is sent.
- A backward-looking high and low window keeps a stop or size input from depending on later prices.
Open-to-extreme stretch
A one-bar peak excursion is the larger of the high-minus-open and open-minus-low distances, then divided by the open. That reading is the near-term unit of stretch.
An n-bar peak excursion compares a reference open from the start of the window with that window's highest high and lowest low, then scales the larger distance by the reference open. Over a chosen window, the larger open-to-high or open-to-low stretch is the unsigned distance a stop or loss limit must be able to absorb.
Average peak excursion
Average peak excursion is a moving average of those one-bar and n-bar peak-excursion series. Several constructions use a 250-bar averaging length. The averaged reading is a stable input to size, stop, and filter rules.
Tendency-to-trend coefficient
The tendency-to-trend coefficient, alpha, is the logarithm of n-bar average peak excursion over one-bar average peak excursion, divided by the logarithm of the window length. Average peak excursion is unsigned, so a large alpha can accompany a strong move in either direction.
The same alpha construction can be used as a pre-trade filter by requiring the log-scaled n-bar-to-one-bar ratio to exceed a small positive floor such as 0.01.
APE alpha ranks names by tendency to trend
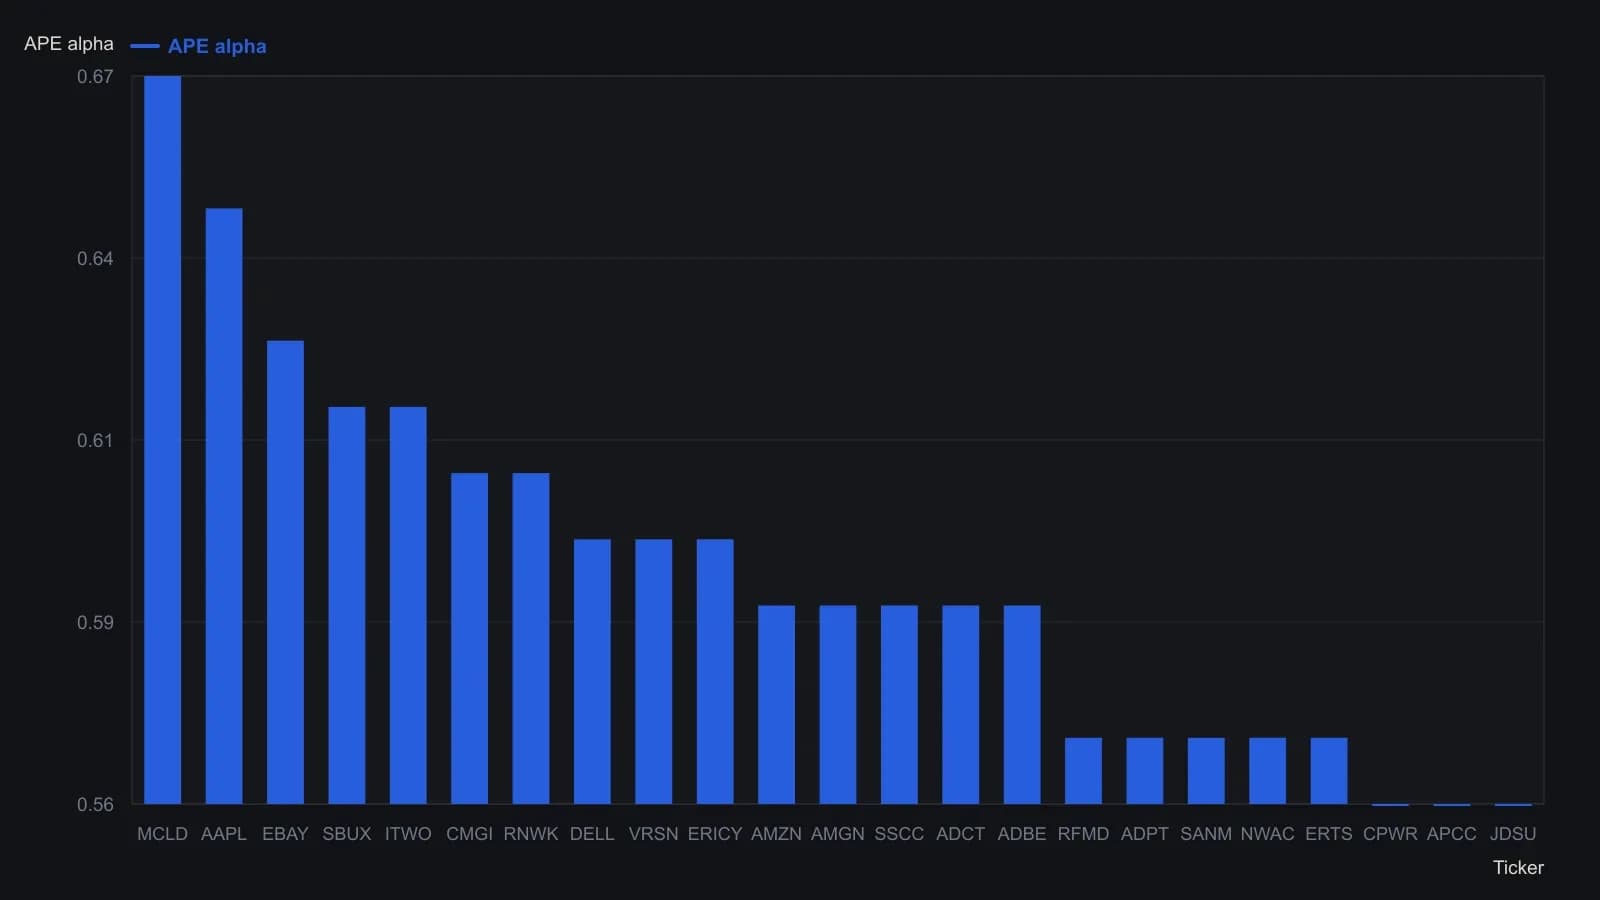
Exploration window 30 Sep 2004 to 30 Sep 2005; N = 20; 253-bar average. Table shows 23 of 78 rows, sorted by alpha descending.
Risk-reward ratio and volatility position sizing
A relative reward-versus-risk reading is the n-bar average peak excursion divided by a lagged one-bar average peak excursion. That risk-reward ratio is a filter for whether a longer window is adding stretch relative to single-bar noise.
A volatility position-size rule can set unit weight in inverse proportion to a price-normalized average peak excursion and then scale that weight to combined basket equity. The rule allocates fewer units when that average is larger and more units when it is smaller.
Companion series for stops
The same peak-excursion family can be shown as three non-price series: average peak excursion, alpha, and relative reward versus risk. The family can also be applied when evaluating stops.
All readings on this track · 15 readings
- 1987Evaluating a black-box pyramiding routine with adverse excursion
- 1991Set the first stop from a capital-scaled MAE histogram
- 1991Opening gap fades bounded by excursion and time stops
- 1991Stop bounds versus added system parameters
- 1991Bound losses with MAE, stops, and drawdown limits
- 1992Multi-year evaluation of MAE-bounded mechanical rules
- 1992Moving-average add-ons could not be separated by maximum adverse excursion
- 1992Evaluating maximum-adverse-excursion stop reversals with short time stops
- 1992Failed range trades as breakout-system tests
- 1998Fitted moving averages for trend add-on entries
- 1998Monthly changer rules specified as one mechanical procedure
- 2002An excursion cutoff test for stops and profit exits
- 2006Constructing peak-excursion filters for stops and size
- 2006Cost-aware excursion filters for stops and holding period
- 2017Staged stops, drawdown limits, and mechanical risk survival