2007issue C091-4
Why premove fundamentals rarely flag tenfold-price moves
At the move point an analyst has only backward-looking facts. A fundamental overlay can compare a candidate with the market, but premove earnings, growth and value-style metrics did not mark which names were about to start a tenfold-price move.
- Editorial lesson: treat a tenfold-price hunt as a regime-context problem and use a fundamental overlay as a filter and humility check, not as a launch detector.
- In a sample of 30 tenfold names, about 75% had negative earnings per share at or before the move, and the earnings path a year earlier still did not mark which names were about to reprice.
- A price-to-sales screen under 0.50 gathered more than 60% of the tenfold names into about 22% of the market and lifted statistical confidence from 0.4% to 1.1%, still too thin to treat as a launch signal.
- Premove sales growth was modest, and sales-to-assets, gross profit and shares outstanding tracked the broader market, so the names did not look like a clean growth or value set before the reprice.
What the hunt is looking for
A typical tenfold-price move is a stock that rises ten times in price over roughly three years, implying about a doubling each year, though some names reprice in months and others overshoot that ceiling.
The move point is the last historically visible moment before the large reprice. After that point the outcome is unknown to the analyst standing at the decision.
Cause versus support
At the decision the analyst only has backward-looking facts. The post-entry path is treated as unknown, so two loosely linked datasets are required: historical cause and forward support.
Cause versus support splits those jobs. Historical facts describe how a company met past challenges. Forward-looking support would be needed to treat the name as an investment rather than a completed story.
How the overlay is built
A fundamental overlay compares a candidate's accounting and valuation metrics to the broader market so that one trade sits in a diversified or regime-aware context rather than in isolation.
Dividend screens are set aside for this hunt because such names rarely pay a dividend. The overlay instead borrows rules from growth investing and value investing.
Earnings at the move point
In a sample of 30 recent tenfold names, about 75% showed negative earnings per share at or before the move versus about 10% of the overall market. Only about 3% of those names had earnings per share above 1 versus about 55% of the market.
Group earnings a year before the move looked better than at the move, but the earnings-per-share path still did not mark which names were about to reprice tenfold.
Price-to-sales as a filter
Price-to-sales is market value divided by sales. It is used here as a cross-sectional filter rather than as a valuation commandment.
More than 60% of the tenfold names came from about 22% of the market once the screen was limited to a price-to-sales ratio under 0.50, lifting hit-rate style confidence from 0.4% to 1.1%.
Statistical confidence is how much more often a screen would have contained eventual tenfold names than a random pick. It is treated as the inverse of residual risk, not as bravado.
Single-metric overlays on price or price-to-earnings roughly doubled confidence versus a random pick, but readings near 1% (about 0.86% on price) were still treated as too thin to act as a launch signal.
Growth and value labels
Growth investing seeks companies whose sales or earnings are expected to expand. Median annual sales growth for the tenfold group was only 2.98% before the move, so premove growth did not announce the later rally.
Value investing buys companies as if they were discounted businesses. On sales-to-assets, gross profit, and shares outstanding, the tenfold group tracked the broader market rather than looking like neglected bargain names. Those operating metrics did not support a high-confidence projection or a classic value label.
Sales-to-assets is an efficiency and capacity check. A low reading can mean spare room to grow or unused assets, and here the tenfold group merely resembled the market on the high side.
Shares outstanding is a leverage-style lens. Fewer shares relative to sales can magnify profit per share, but in this sample it did not separate tenfold names from the market.
What past fundamentals can show
Past fundamentals can confirm a move already under way but cannot show that a tenfold-price move is about to start.
Premove sales-growth medians did not flag the tenfold names
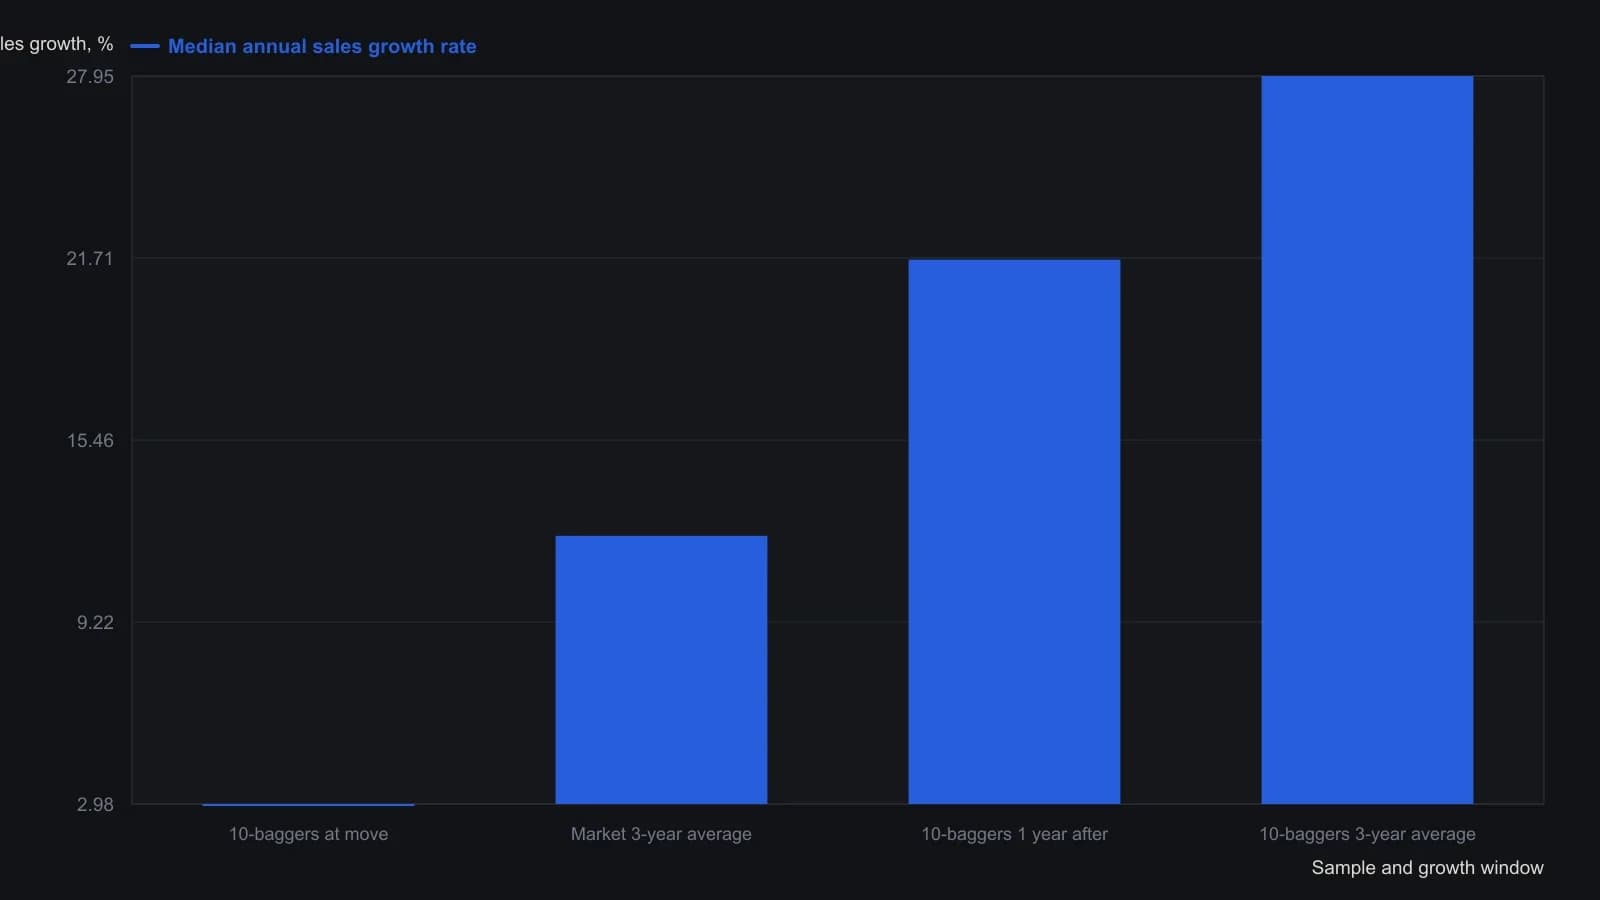
Medians are the values printed for the article’s 10-bagger sample versus the overall market. The archive raster of the histogram has tick labels and legend text stripped, so the bin-by-bin bars were not digitized.
All readings on this track · 16 readings
- 1988A two-rule classroom book of cheapness and new highs
- 1995A supermarket-chain case for yield, trendline, and a written checklist
- 1996Annual normalized-yield rank rotation for cyclical sleeves
- 1996Value filter then rank-rotate as one procedure
- 1997Dow high-yield rank rotation as a testable portfolio procedure
- 1998Low relative P/E plus a trendline reversal for regime-aware stock selection
- 1998Rank rotation, value screens, and ten-stock diversification
- 2001Earnback period ranking for growth-adjusted screens
- 2003Stress-testing calendar yield rotation in a declining tape
- 2003A value overlay and strangle hedge during a growth-led regime
- 2005Unfashionable value versus momentum in the book
- 2007Why premove fundamentals rarely flag tenfold-price moves
- 2012Year-end yield rank rotation with a collapse veto
- 2015A five-name January book from yield and price ranks
- 2017Screening value traps with regime-aware overlays
- 2017A pre-trade fail test for the cheap-looking name