2017issue C1015
Screening value traps with regime-aware overlays
Apparent cheapness is a hypothesis to stress-test. A discounted name earns a longer-horizon slot in a diversified, regime-aware book only after earnings-quality, product-cycle, and industry-structure overlays fail to show a value-trap.
- Pursuing value is separated from becoming stuck in a cheap-looking name whose problems raise the chance of further decline rather than recovery.
- A price-to-earnings multiple by itself is a weak basis for buying, avoiding, selling, or shorting because it conveys little about future potential.
- Earnings-quality screens look for special-item write-offs that dress reported profits and for mismatches between revenue or receivables growth and earnings growth.
- A single-digit share price is not cheapness. Inventories, margins, overhead, management, competition, and market context still have to be examined.
Cheapness is a hypothesis
Pursuing value is separated from becoming stuck in a cheap-looking name whose problems raise the chance of further decline rather than recovery.
A value-trap is a holding that looks inexpensive on price or multiples while operations, earnings-quality, or industry-regime argue against ownership.
Earnings-quality on the overlay
A fundamental-overlay applies company-level quality and industry-structure checks on top of a cheap-price or cheap-multiple screen.
Earnings-quality asks whether reported profits line up with revenue, collections, and one-off write-offs rather than cosmetic accounting. Screens include special-item write-offs that dress reported profits and mismatches between revenue or receivables growth and earnings growth.
Cheap versus low price
Cheap-versus-low-price is the distinction between a small quoted share price and an economically attractive stake after margins, inventories, overhead, and competition are examined.
A single-digit share price is distinguished from cheapness. Inventories, margins, overhead, management, competition, and market context still have to be examined.
Industry-regime in retail
A contemporaneous pair of retailer multiples, one very high and one low, is used to show that the cheaper multiple is not a sufficient argument for ownership.
Retail analysis is framed as needing spend mix, channel (online versus physical stores), inventory-turnover trends, product-line saturation, and new-product pipelines, not headline consumer-spending strength alone.
A shift toward online retail is posed as a macro force that can make a discounted physical-store name a poor candidate even when the quote looks inexpensive. That force is an industry-regime check: cross-market forces such as where consumers spend and whether a channel is expanding or shrinking, used to judge if a discounted name belongs in the book.
What a metrics-only reading misses
A qualitative reading of fundamental metrics can miss competitive-advantage unless industry structure and rival product quality are part of the overlay. Competitive-advantage is a durable edge that a metrics-only reading of the financials can miss when peer and product quality are ignored.
Amazon vs Macy's P/E, 2013 and August 2017
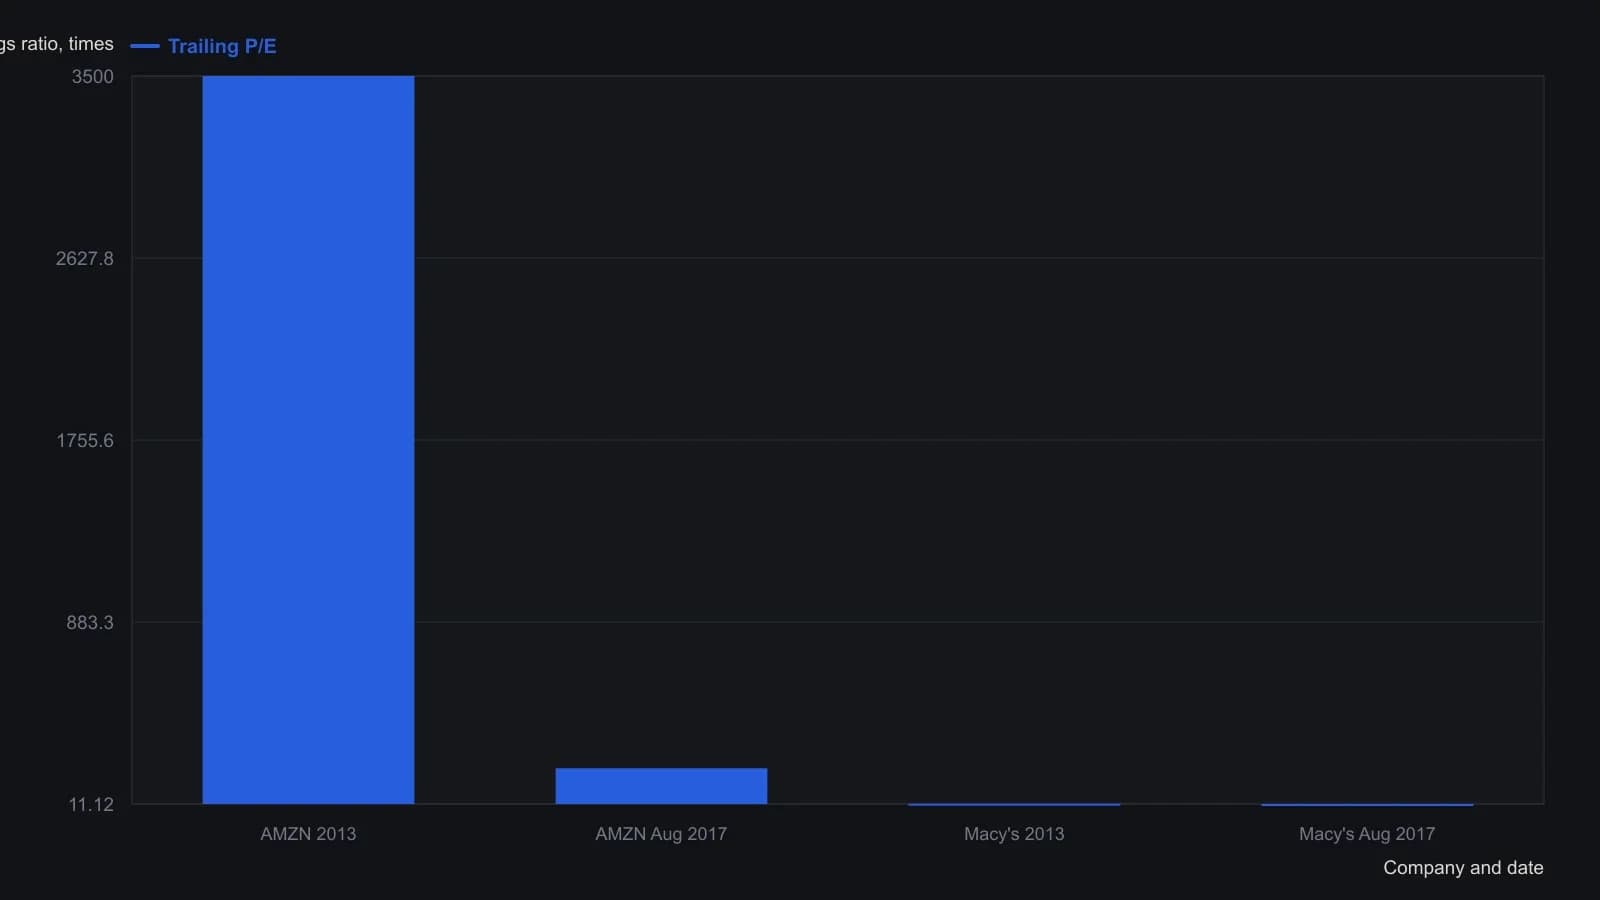
Macy's 2013 multiple is the column's "around 12.50" figure. August 2017 readings are the stated August 11 close. The accompanying share-price paths are labeled approximations in the source and are not plotted here.
All readings on this track · 16 readings
- 1988A two-rule classroom book of cheapness and new highs
- 1995A supermarket-chain case for yield, trendline, and a written checklist
- 1996Annual normalized-yield rank rotation for cyclical sleeves
- 1996Value filter then rank-rotate as one procedure
- 1997Dow high-yield rank rotation as a testable portfolio procedure
- 1998Low relative P/E plus a trendline reversal for regime-aware stock selection
- 1998Rank rotation, value screens, and ten-stock diversification
- 2001Earnback period ranking for growth-adjusted screens
- 2003Stress-testing calendar yield rotation in a declining tape
- 2003A value overlay and strangle hedge during a growth-led regime
- 2005Unfashionable value versus momentum in the book
- 2007Why premove fundamentals rarely flag tenfold-price moves
- 2012Year-end yield rank rotation with a collapse veto
- 2015A five-name January book from yield and price ranks
- 2017Screening value traps with regime-aware overlays
- 2017A pre-trade fail test for the cheap-looking name