1994issue C081-11
Quality screens and dividend-yield regime maps
This archive case study first froze a 350-name quality-gate, then placed each name and a major industrial average on a recurring yield-regime-calendar. Editorial reading: only after that map showed a scarce-value season did the workflow convert classification into dollar-cost-averaging rather than a one-shot entry.
- The quality-gate and a historical-value location were joint conditions, so a high-quality name was not treated as cheap merely because it was high quality.
- After admission, each name's yield-profile set unique undervalued-band and overvalued-band rails from repeated high-yield and low-yield extremes, then assigned four holding states with 10% bands.
- Seasonal-analysis applied the same yield-profile to a major industrial average, while the undervalued-share-indicator measured how much of the 350-name universe sat in the undervalued-band.
- When the universe was value-scarce and a decline was underway, dollar-cost-averaging bought already-undervalued names with a fixed cash amount on a monthly or quarterly schedule.
Freeze the quality universe first
The archive workflow built a working list with a quality-gate, then located each admitted name on its own yield-profile. Value-investing here meant quality first, then a regime from repeated high-yield and low-yield extremes, so a single name sat in a diversified, regime-aware context.
The process treated a quality screen and a historical-value location as joint conditions, not substitutes. A high-quality name was not treated as cheap merely because it was high quality.
Editorial: read the workflow as a two-rail map. First freeze a quality universe. Next place each name, and the market, on a recurring yield-regime-calendar. Only after that map shows a scarce-value season does classification turn into a fixed-interval accumulation rule rather than a one-shot entry.
The quality-gate
Admission to a 350-name working universe required six simultaneous tests: at least five dividend increases in 12 years, an A-band quality rank, at least five million shares outstanding, at least 80 institutional holders, 25 years of uninterrupted dividends, and earnings improvement in at least seven of the last 12 years. That six-rule screen is the quality-gate.
The 25-year uninterrupted-dividend rule existed so each name would have completed several full up-and-down cycles. Those cycles supplied repeated peak and valley yield extremes from which a recurring value-season map could be drawn.
Name-level yield-profile
After the quality-gate, buy and sell zones came from that name's own dividend-yield history. Repeated high-yield extremes marked historically undervalued areas. Repeated low-yield extremes marked historically overvalued areas. Those rails were unique to each name, and that path is the yield-profile.
Four holding states were assigned with 10% bands around those yield-implied prices. The undervalued-band sat within 10% of the undervalued price. The rising-trend-bucket began after a 10% rise from that base. The overvalued-band sat in a 10% band below the overvalued price. The declining-trend-bucket began after a 10% decline from an overvalued peak.
One illustrated name that met all six quality tests had an overvalued yield line of 1.2% reached in 1987 and later sat near a 5% undervalued yield line.
Undervalued blue chips: current yield vs overvalued rail
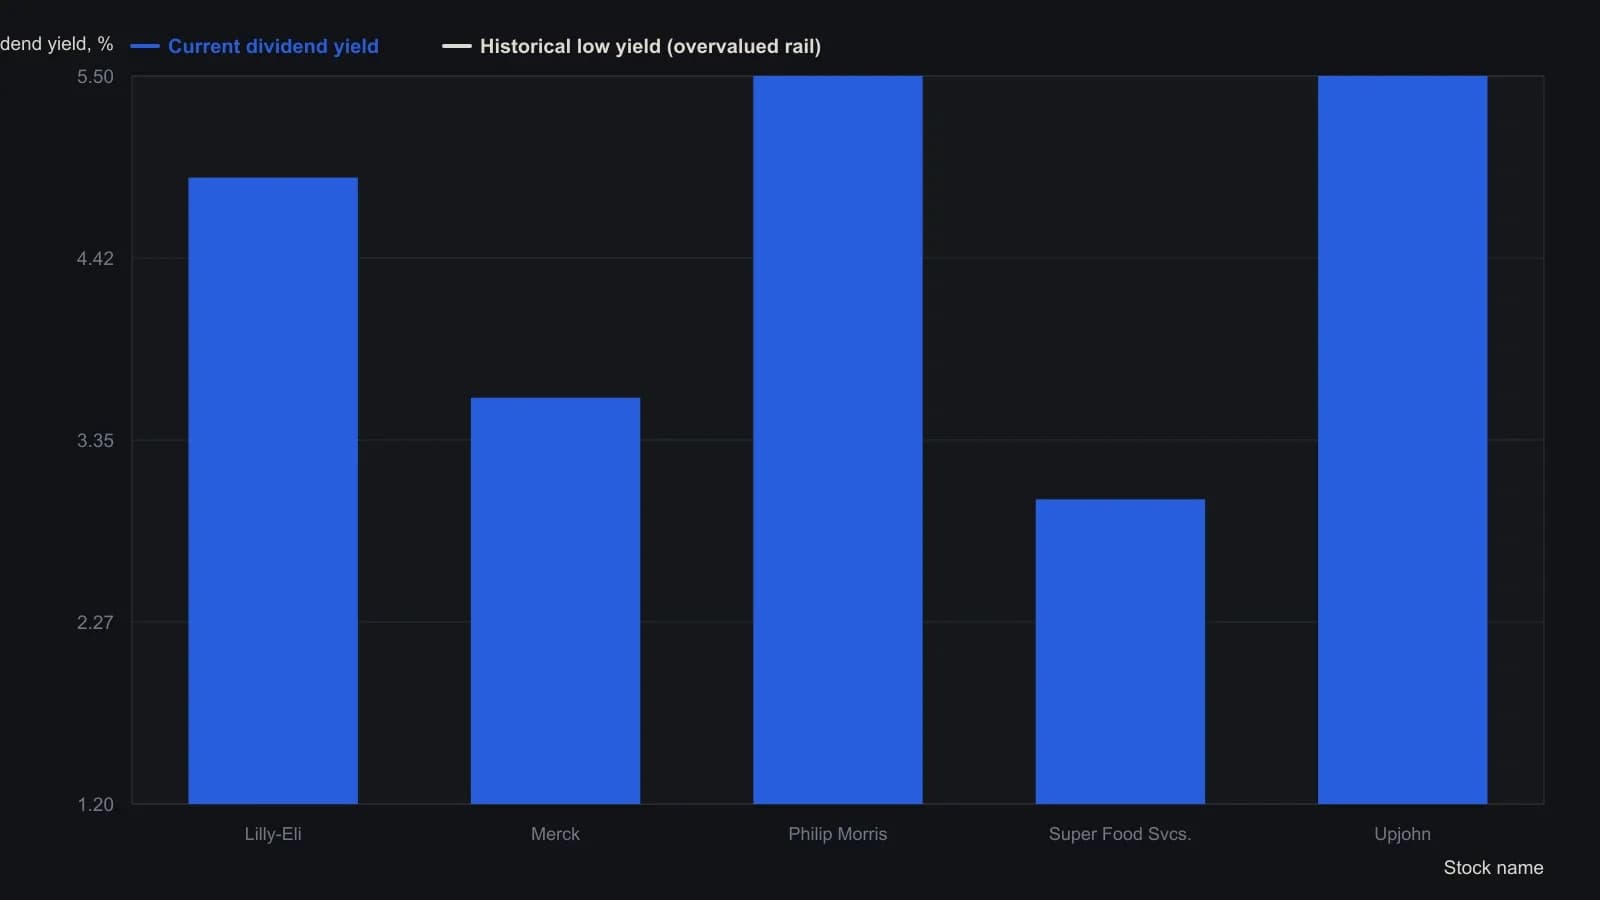
The printed table is a five-name extract from the 350-stock quality universe. A name enters the undervalued sleeve when price is within 10 percent of the historical high-yield buy area.
Index seasons on the yield-regime-calendar
The same yield-profile method was applied to a major industrial average after a review spanning about 100 years. Seasonal-analysis treated a dividend yield of 5% or more as an undervalued season, 3% or less as an overvalued high-risk season, and 4% as a mid-cycle level where many past declines paused. A contemporaneous reading near 2.8% was classified as overvalued.
Those index lines, together with the name-level extremes, form the yield-regime-calendar: a recurring sequence of high-yield and low-yield seasons at name and index level, including that mid-cycle 4% pause.
The undervalued-share-indicator
A breadth verifier counted the share of the 350-name universe sitting in the undervalued-band. That share is the undervalued-share-indicator, used as a market-wide scarcity gauge.
Readings of 80% or more coincided with historically cheap average-level conditions in 1974, 1978, 1980 and 1982. Readings below 17% coincided with major-cycle caution points. One observation of 6% was the lowest in 28 years of the series.
From scarce value to dollar-cost-averaging
When the universe was judged value-scarce and a decline was underway, accumulation was specified as dollar-cost-averaging: a fixed cash amount on a monthly or quarterly schedule into already-undervalued names. The same staged rule was used for utilities after an approximate 30% utilities-average decline when the payout was described as at least 85% of earnings.
Editorial: the holding period of that rule is the system holding period. The map decides whether accumulation is even in force. The cash schedule is only the testable entry procedure.
When a dividend increase moves the rails
Because the rails were yield levels rather than fixed prices, a dividend increase lifted both the overvalued and undervalued price levels. An overvalued name could remain in that regime for a long stretch if the dividend kept rising. The quality-gate still had to keep holding, but cheapness was reread from the moved yield-profile, not from the quality rank.
All readings on this track · 11 readings
- 1989Testing dollar-cost and scale-in averaging as position-sizing procedures
- 1994Quality screens and dividend-yield regime maps
- 1998Cash recovery grids for residual share construction
- 2001Building custom stock baskets with weights and averaging
- 2012Evaluating dollar-cost averaging as an entry-slot procedure
- 2013Treat a short-term valuation oscillator as an entry-timing filter
- 2014Equal-dollar staging versus lump-sum and residual scaling
- 2015A fund pick is unfinished until cost-drag and the mix are tested
- 2016Broad index allocation, a cash reserve, and staged entries
- 2017Call-ratio overlay versus averaging down on a losing stock
- 2019Overfunding smaller index futures to set leverage