2003issue C021-5
A value overlay and strangle hedge during a growth-led regime
This archive case follows one unloved equity near the end of a multi-year growth-led advance. It shows how a market-regime clock, a fundamental-overlay clock, and an options-strangle clock can sit on the same name so valuation context, rather than charts alone, is what selected the name and justified holding through breakdowns.
- Read the market-regime first: a long growth-led advance can make classic value measures look obsolete even while they still describe an ignored name.
- Use a fundamental-overlay so earnings, the price-to-earnings multiple, or dividend yield can be read on the same chart as price.
- An options-strangle around a cash long is a defined exit plan that can survive a failed-breakout without dropping the thesis.
- The archive states that valuation context selected the name and justified holding through technical breakdowns.
Three clocks on one name
The write-up argues that prices take time to absorb changing fundamentals, and that chart-based traders can inspect the same decision metrics used by large fundamental holders.
Earnings per share, dividend yield, or price-to-earnings can be shown as a linear time series overlaid on a price chart in charting software or a spreadsheet. That plot is the fundamental-overlay: valuation context and price action are read together.
The regime clock
The illustrated winter-2000 setup sat near the end of a multi-year growth-led advance that began in 1995. Popular growth names were favored, and classic value measures were widely treated as obsolete.
That climate is the market-regime in this case: a multi-year growth-led advance rather than a later rotation toward cheaper, income-oriented names. Value-investing here means selecting names that look cheap on earnings, price-to-earnings, or yield while that regime still prefers growth stories.
The overlay clock on an ignored name
The example equity had been driven to multiyear lows by adverse news and net institutional selling, even as the weekly chart showed a struggle to rebound. That selling is institutional-flow: large fundamental holders whose size can reprice a name independently of a short-horizon chart signal.
A long-term monthly overlay showed earnings still rising while price fell, with the price-to-earnings multiple at a 10-year low and dividend yield approaching double digits. The disagreement is what the fundamental-overlay is built to show.
Philip Morris P/E multiple, 1990–1999
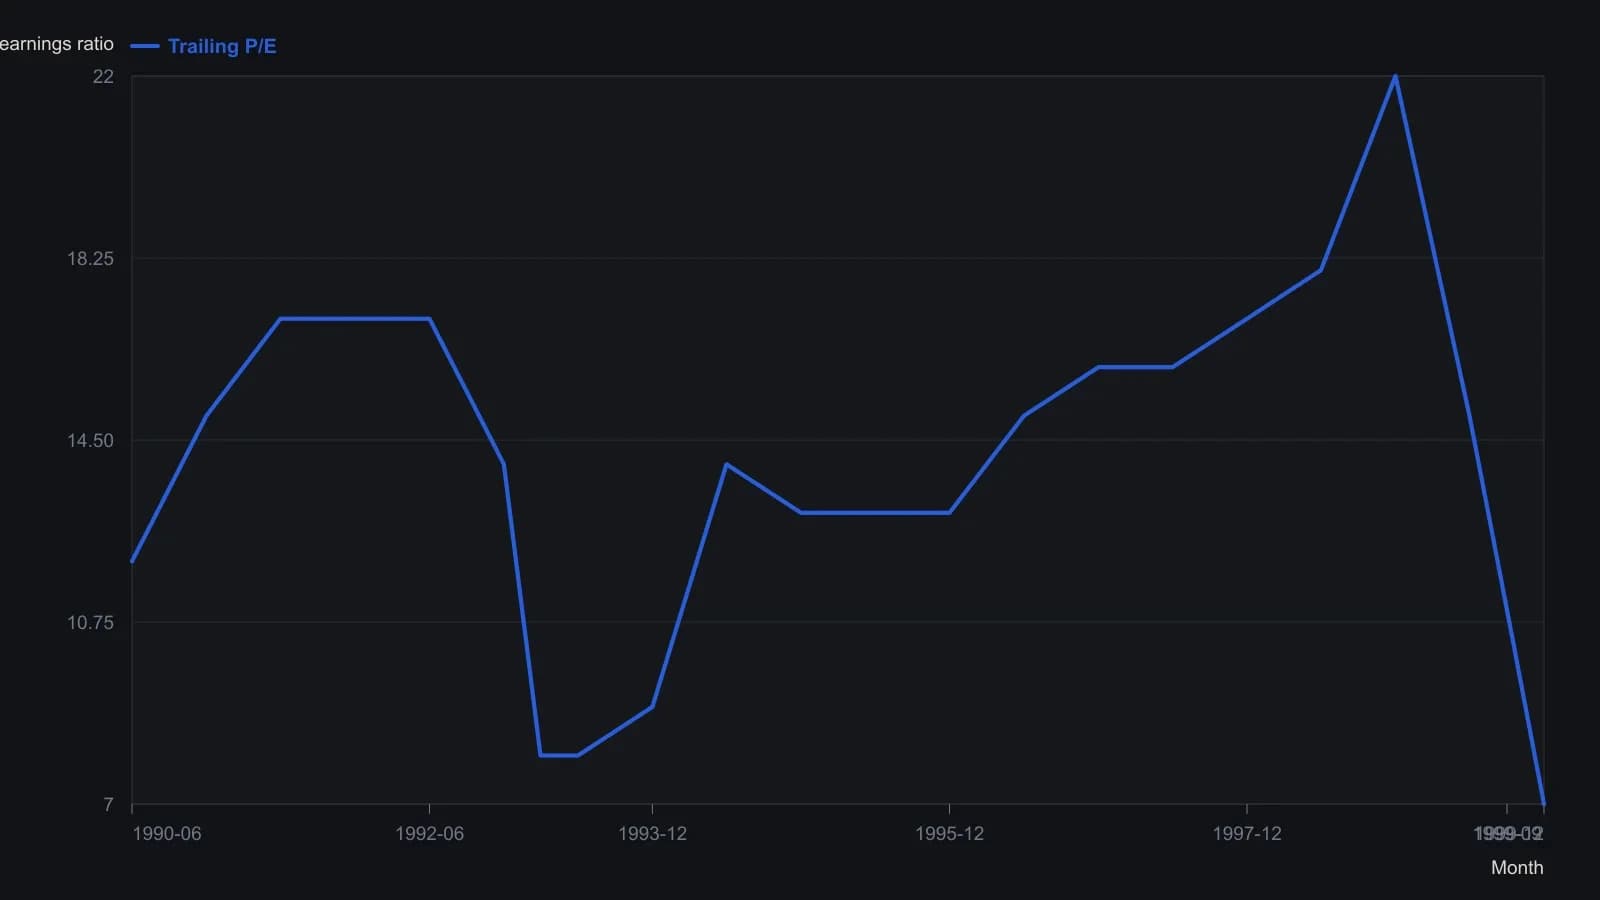
The P/E pane is small on the source raster, so readings are approximate to the nearest 1.0 and are not official prints.
The strangle clock as a defined exit
The cash long opened on January 13, 2000 was immediately hedged by selling March 27.5 calls and buying March 22.5 puts. The archive frames that pair as a defined exit plan rather than an unhedged conviction bet.
That pair is the options-strangle: a short call with a long put around an existing cash long so early entry or a failed-breakout can be survived without dropping the thesis.
What followed the failed-breakout
After a failed upside breakout, the short calls were covered while the puts were kept as insurance, and the name then chopped near the lows for about two months. A failed-breakout is an upside technical break that does not hold and is treated as a warning of a sharp move the other way.
A mid-March review used a possible double bottom, bullish RSI divergence, a parabolic reversal cue, and large-block buying on dips. A late-March gap that held prior lows later cleared the 50-day and 200-day averages.
Later option overlays were traded around upside spikes and corrections until a February option assignment closed the stock.
What selected the name
The write-up states that valuation context, not charts alone, selected the name and justified holding through technical breakdowns.
TradersWeek editorial: the archive uses the chart reviews to time overlays and insurance. It does not treat those reviews as a replacement for the fundamental-overlay that first put the name on the list.
All readings on this track · 16 readings
- 1988A two-rule classroom book of cheapness and new highs
- 1995A supermarket-chain case for yield, trendline, and a written checklist
- 1996Annual normalized-yield rank rotation for cyclical sleeves
- 1996Value filter then rank-rotate as one procedure
- 1997Dow high-yield rank rotation as a testable portfolio procedure
- 1998Low relative P/E plus a trendline reversal for regime-aware stock selection
- 1998Rank rotation, value screens, and ten-stock diversification
- 2001Earnback period ranking for growth-adjusted screens
- 2003Stress-testing calendar yield rotation in a declining tape
- 2003A value overlay and strangle hedge during a growth-led regime
- 2005Unfashionable value versus momentum in the book
- 2007Why premove fundamentals rarely flag tenfold-price moves
- 2012Year-end yield rank rotation with a collapse veto
- 2015A five-name January book from yield and price ranks
- 2017Screening value traps with regime-aware overlays
- 2017A pre-trade fail test for the cheap-looking name