2005issue C121-4
A range-market breakout watchlist with 50-day pullbacks and stops
This case study put market-direction ahead of later growth filters. A range-bound tape began with sector-leadership, then new 52-week highs, a wait for the 50-day moving-average or a consolidation, a short breakout window, and a 7-8 percent stop-loss on every entry.
- Market-direction was named before growth filters, so a range-bound tape started with sector selection rather than individual names.
- After the regime was set, sector-leadership limited the scan to recent leading groups and then to new 52-week highs, with price structure ranked above fundamentals.
- New highs were parked on a refreshed watchlist for a first 50-day moving-average pullback or a typical seven-week consolidation, then demoted if a breakout did not confirm within about two weeks.
- Every position carried a 7-8 percent stop-loss at entry, with a later repurchase allowed at the breakout zone or the 50-day average after a scale-out.
Market direction before the name list
When this workflow classified the tape as range-bound, market-direction came first. Later growth-screen filters waited. The range-bound reading was treated as a cue to begin with sector selection rather than with individual names.
Sector leadership, then new 52-week highs
After a regime was named, the screen isolated recent leading sectors and only then scanned for stocks printing new 52-week highs. That is sector-leadership: candidates were limited to groups that already led over a recent multi-month window, and the group's earnings leaders were preferred over laggards.
Price structure was given priority over fundamentals for the advance. The stated view was that strong fundamentals alone do not force a rise, while a favorable supply-demand setup can.
Two-month leaders among Dow Jones US industry groups
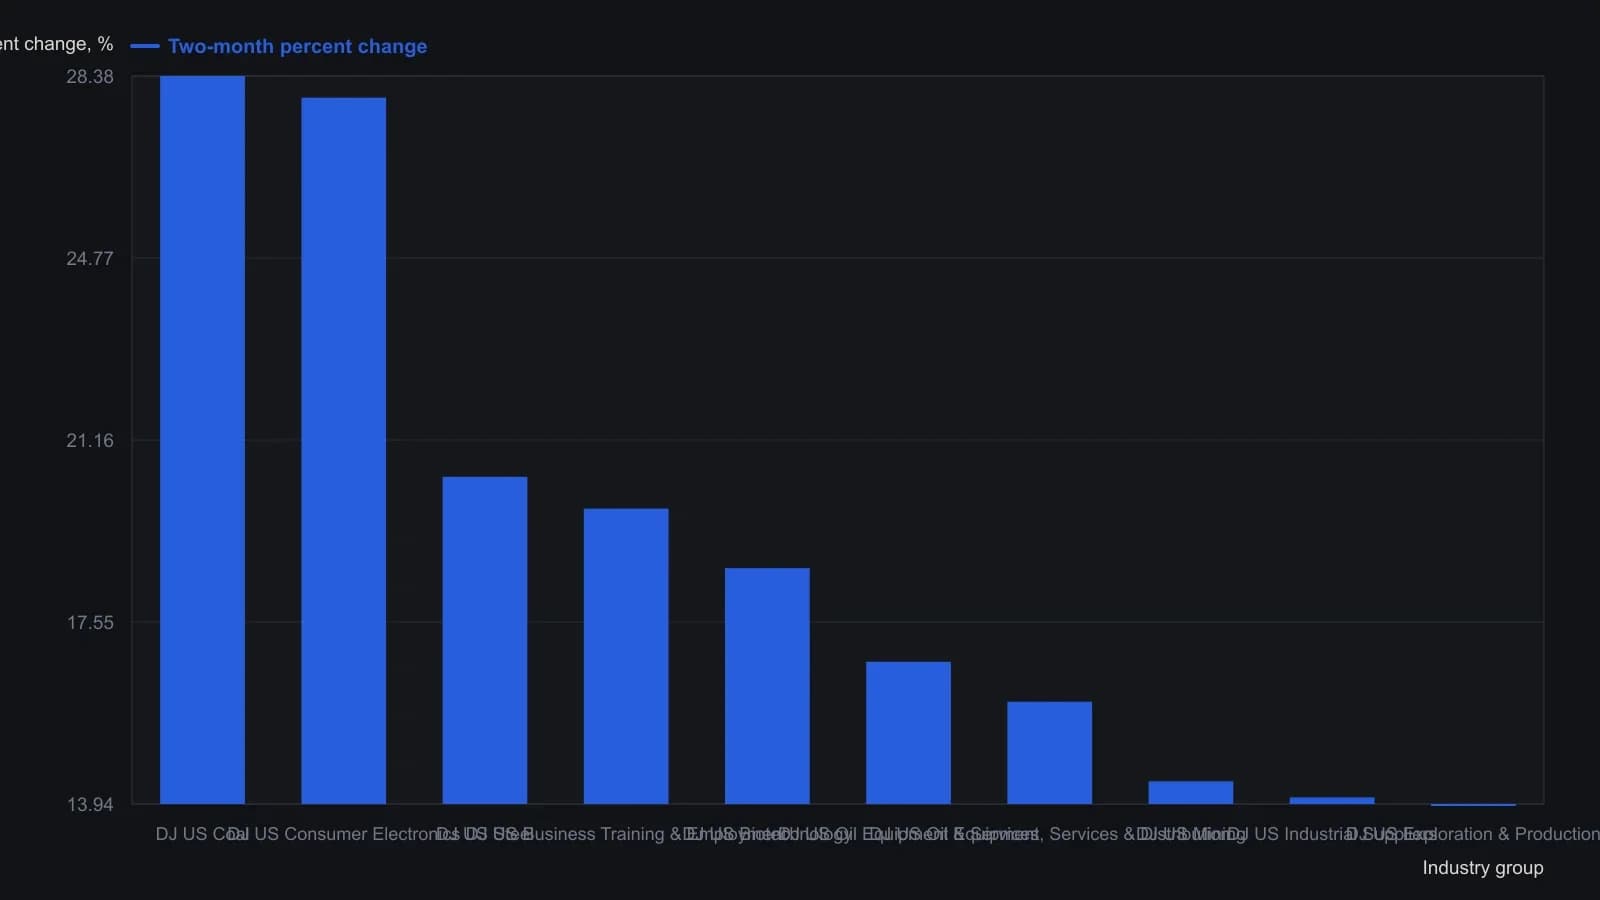
The source fixed the ranking window at two months. The coal-index last of 272.86 is the 31 August 2005 daily close, not the two-month change plotted here.
The 50-day test and a short breakout window
New-high names were added to a regularly refreshed watchlist. The first event being waited on was a pullback to the 50-day moving-average or a consolidation, described as typically lasting seven weeks, before another breakout attempt.
In this workflow a breakout is a thrust through a defined consolidation or prior high. It had to confirm inside a short watch-window or be demoted. Watchlist-promotion kept names nearest a breakout at the top and dropped them if they failed to break out within about two weeks or if the breakout failed. The moving-average served as the first-pullback entry line after a new high.
A new high that was set aside
In the worked example, a new-high name was set aside after a multi-year chart looked range-bound against old resistance and after combined institutional and insider ownership looked heavy. Institutional-sponsorship was used as a supporting filter rather than a buy signal. A sector earnings leader with a smaller share count and lighter, recently accumulated sponsorship was preferred instead.
A fixed stop at entry
After entry, the documented risk rule was a 7-8 percent stop-loss on every position. The stop-loss was a fixed percentage exit attached at entry so a failed breakout hypothesis had a bounded loss.
The same money-management note allowed a later repurchase if price returned to the breakout zone or to the 50-day moving-average after an initial scale-out. That later use of the moving-average was a re-entry reference.
All readings on this track · 20 readings
- 1982Constructing a funnel from converging support and resistance
- 1990Bond trends as auction tests at prior highs
- 1995Constructing mechanical trendline breakout entries
- 2000Crowd balance points before a range-breakout
- 2000Breakout rules fail without tested exits
- 2002Waiting for setups instead of forcing trades
- 2003The 20-day channel high as a support test after breakout
- 2004Intermediate-term breakout rules and fifty-day exits
- 2004A three-check drill for support and resistance
- 2004Weekly exponential averages turn from breakout rails to resistance
- 2005Constructing a three-state moving-average breakout histogram
- 2005A three-state directional breakout on a moving-average midline
- 2005A range-market breakout watchlist with 50-day pullbacks and stops
- 2009Optimism bias, breakout adds, and predefined loss limits
- 2015Refuse mixed-horizon entries until the checklist locks one persona
- 2017Intraday breakouts planned from whole-number support and resistance
- 2017A fractal-dimension regime-gate for mechanical breakout entries
- 2018Trend-first FX walls stay a hypothesis until a second touch, RSI recross, or failed break
- 2019Constructing a sell-relative-strength-index from the intrabar range ratio
- 2020Decluttered charts for breakout, support, and stop rules