2003issue C101-3
The 20-day channel high as a support test after breakout
In an uptrend, a breakout is prices leaving a prior range or prior high. The working rule stays live only when the former 20-day high flips to support, with volume-confirmation and next-session follow-through deciding whether the hypothesis is confirmed or cancelled.
- A breakout can be a move out of consolidation to a higher high, or a high, a pullback, and a higher high without a textbook range.
- A 20-day high/low price channel names the former high that should flip from resistance to support after the new high.
- If prices do not stay above that former 20-day high immediately, the market may not be ready for its quickest advance.
- Volume-confirmation and next-session follow-through decide whether the support test confirms the rule or cancels it.
What counts as a breakout
In an uptrend, one working definition of a breakout is prices leaving a consolidation range and marking a higher high. A high, a pullback, and then a higher high can count as a breakout even when no textbook consolidation range preceded the move. Either path is a price event in which the market leaves a prior range or prior high by printing a new high after consolidation or after a pullback.
The twenty-day price channel
A 20-day high/low price channel is used as a consistent way to choose which former highs become the support candidates after a breakout. The channel is a band drawn from the highest high and lowest low of the prior 20 sessions. It is used both as the breakout trigger and as the source of the support candidate.
Resistance-turned-support after the new high
After a new 20-day high, the prior 20-day high is treated as resistance that should flip to support and hold if the market is ready to continue. If prices do not remain above that former 20-day high immediately after the break, the market may not yet be ready for its quickest advance, even if prices later move higher.
Yahoo! daily close versus the broken 20-day high
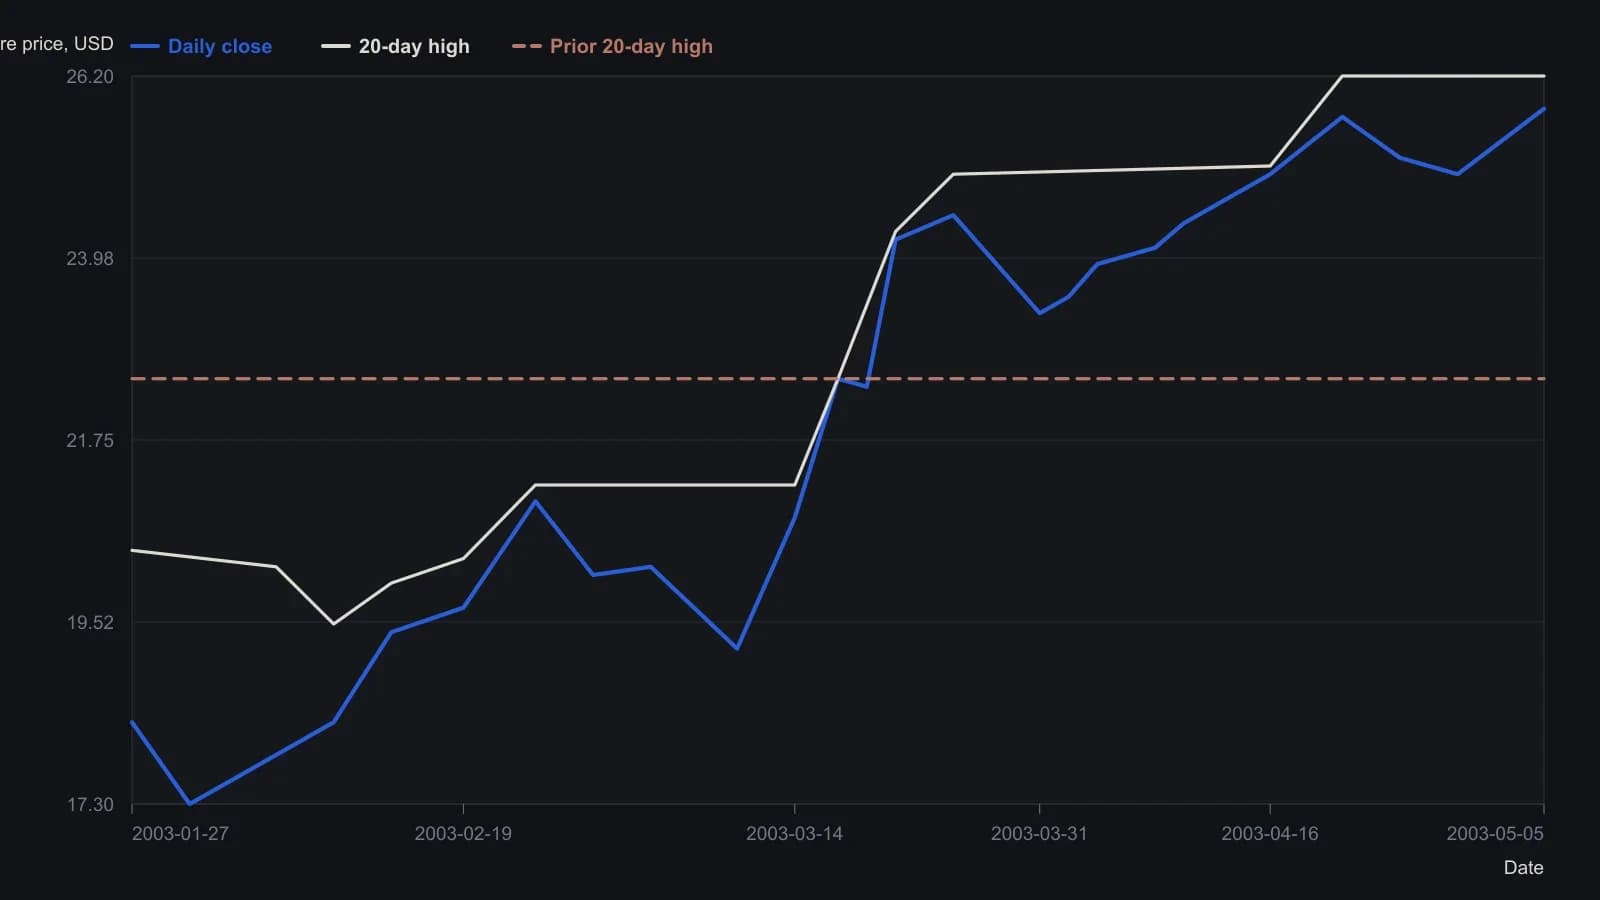
Closes and the 20-day high are approximate to one tenth of a dollar because they were read from the printed candlestick raster, not from a table. The 22.50 support is the old 20-day high stated in the text.
Volume-confirmation and follow-through
High volume at the same time prices leave a consolidation range is treated as an extra check that the breakout is more likely to last. A 20-day high printed on relatively light volume can fail when prices later close back beneath the most recent 20-day high. Follow-through is a later session that continues in the breakout direction and keeps price above the former high.
Editorial reading: volume-confirmation and next-session follow-through decide whether the support test confirms the rule or cancels it.
Incomplete attempts and invalidation
Incomplete 20-day high attempts that still hold the prior channel high can be read as support building before a later breakout that follows through the next session. The same resistance-turned-support line is also used as a nearby invalidation level if the breakout is false or unduly risky.
All readings on this track · 20 readings
- 1982Constructing a funnel from converging support and resistance
- 1990Bond trends as auction tests at prior highs
- 1995Constructing mechanical trendline breakout entries
- 2000Crowd balance points before a range-breakout
- 2000Breakout rules fail without tested exits
- 2002Waiting for setups instead of forcing trades
- 2003The 20-day channel high as a support test after breakout
- 2004Intermediate-term breakout rules and fifty-day exits
- 2004A three-check drill for support and resistance
- 2004Weekly exponential averages turn from breakout rails to resistance
- 2005Constructing a three-state moving-average breakout histogram
- 2005A three-state directional breakout on a moving-average midline
- 2005A range-market breakout watchlist with 50-day pullbacks and stops
- 2009Optimism bias, breakout adds, and predefined loss limits
- 2015Refuse mixed-horizon entries until the checklist locks one persona
- 2017Intraday breakouts planned from whole-number support and resistance
- 2017A fractal-dimension regime-gate for mechanical breakout entries
- 2018Trend-first FX walls stay a hypothesis until a second touch, RSI recross, or failed break
- 2019Constructing a sell-relative-strength-index from the intrabar range ratio
- 2020Decluttered charts for breakout, support, and stop rules