1990issue C081-4
Bond trends as auction tests at prior highs
Bond prices are described as marking time in bottoms, consolidations, or tops, or trending until a new formation begins. This case reads that record as successive tests at the last absorbed price. The editorial sequence marks that price, treats a failed retest plus a range-break as the working directional hypothesis, and waits for a quiet-retest of a demand-shelf before calling a reversal.
- Mark the last price that absorbed flow as the next testable demand-shelf or supply-cap.
- A failed retest of that level plus a range-break converts auction-balance into a working directional hypothesis.
- Quiet volume on a pullback is a clue that the move is a correction rather than a new opposite trend.
- A reversal call waits for a quiet-retest of a major demand-shelf that suggests sellers have been exhausted.
Marking time or trending
Bond prices are described as either marking time in bottoms, consolidations, or tops, or trending until a new price formation begins. Chart formations are treated as a visual auction record. Buying that absorbs offers lifts price. Anemic buying lets selling press price lower.
The editorial approach is to read that record as a sequence of auction tests at prior highs and lows. Mark the price that last absorbed flow. That price becomes the next demand-shelf or supply-cap worth testing.
Textbook tests at highs and lows
A textbook double bottom is a decline, a bounce, then a second hold at a similar low. Demand absorbs selling at both lows before prices can advance. That second hold is a demand-shelf: a prior low where buying previously absorbed selling and is therefore a testable support level on the next visit.
A textbook double top is a stall at a high, a pullback, then a failed return to that high. Supply contains the rally and selling then exceeds demand. That high is a supply-cap: a prior high where selling previously contained an advance and is therefore a testable resistance level on the next visit.
Pauses that are not reversals
A mid-trend pause can be a non-reversal balance. In editorial terms this is auction-balance: a stretch of two-way trade in which neither side can force a sustained markup or markdown. Bull-market pullbacks attract new buyers. Bear-market rallies attract new sellers who can restart the decline if supply is large enough.
Quiet volume is presented as a clue that a move is a correction. A light-volume retest of a major demand area is the proposed confirmation that sellers have been exhausted. The editorial label for that second visit is a quiet-retest: a return to a demand or supply level on reduced volume, used to ask whether the opposing flow has been exhausted.
A continuation-chart sequence
On a Treasury-bond futures continuation chart of daily closes, the first large multi-week drop after a sustained advance marked that peak as a supply level worth retesting. After a weak probe of old highs, a move below the prior multi-week range was read as a downside breakout from a balance area. In editorial terms that move is a range-break: a move through the boundary of a multi-week balance area that converts the range into a directional hypothesis.
The range-break was followed by a multi-week decline into a later sideways phase. Inside that later range, successive rally highs stayed below the first consolidation high and successive lows made new lows. That structure was treated as evidence that demand remained too weak to reverse the bear trend.
What would reopen a reversal question
The working hypothesis after the failed probe of the supply-cap and the range-break is continued markdown until a new formation begins. A later sideways stretch can still be auction-balance inside the bear trend if rally highs remain capped and lows keep giving way.
The editorial condition for dropping that hypothesis is not the first bounce. It is a quiet-retest of a demand-shelf that suggests selling has been absorbed and sellers have been exhausted. Until that second visit is quiet, the later range is read as weak demand, not as a completed reversal.
T-bond futures daily closes, 1988 continuation
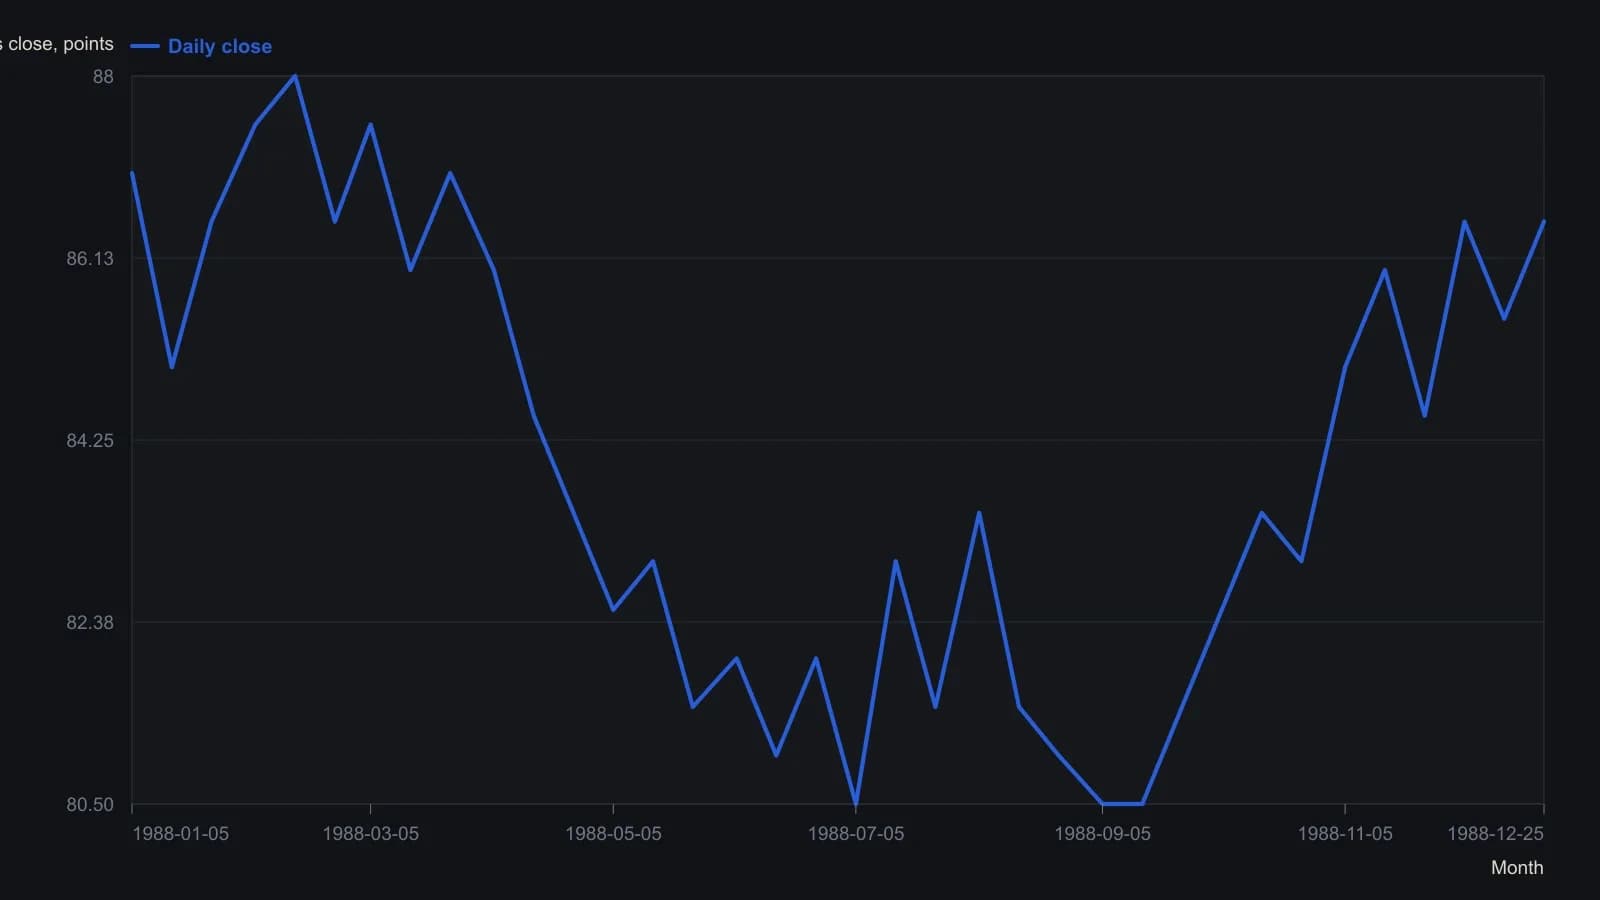
Digitized from a coarse magazine raster of daily closes; prices are approximate to about half a point. The source labeled the contract 1988–89; the printed month axis is a single January–December year.
All readings on this track · 20 readings
- 1982Constructing a funnel from converging support and resistance
- 1990Bond trends as auction tests at prior highs
- 1995Constructing mechanical trendline breakout entries
- 2000Crowd balance points before a range-breakout
- 2000Breakout rules fail without tested exits
- 2002Waiting for setups instead of forcing trades
- 2003The 20-day channel high as a support test after breakout
- 2004Intermediate-term breakout rules and fifty-day exits
- 2004A three-check drill for support and resistance
- 2004Weekly exponential averages turn from breakout rails to resistance
- 2005Constructing a three-state moving-average breakout histogram
- 2005A three-state directional breakout on a moving-average midline
- 2005A range-market breakout watchlist with 50-day pullbacks and stops
- 2009Optimism bias, breakout adds, and predefined loss limits
- 2015Refuse mixed-horizon entries until the checklist locks one persona
- 2017Intraday breakouts planned from whole-number support and resistance
- 2017A fractal-dimension regime-gate for mechanical breakout entries
- 2018Trend-first FX walls stay a hypothesis until a second touch, RSI recross, or failed break
- 2019Constructing a sell-relative-strength-index from the intrabar range ratio
- 2020Decluttered charts for breakout, support, and stop rules