2006issue C051-5
NTRI and the 2005 bowl breakout case
A historical NTRI case treats a Rounded bottom as a long saucer base that becomes a buy signal only after price clears the lip. Breakout confirmation is tied to a high-volume move, and the archive author then uses a more liberal Stop-loss order to stay with a short follow-through rather than a long hold.
- A Rounded bottom is described as a long, saucer-like base and is treated as a buy signal only after price clears the lip.
- Breakout confirmation is described as a move above the lip on volume that at least doubles the low volume from the dip.
- On NTRI, the bowl ran from March 2004 to a February 2005 break of a 52-week high near 4, after December 2004 news first lifted volume more than price.
- Editorial reading: keep the idea alive with a Stop-loss order that can survive noise, and do not convert the case into a buy-and-hold story.
A long base that is not yet a trade
A bowl or Rounded bottom forms as a long, saucer-like base. The archive treats that shape as a buy signal only after price clears the lip of the structure.
The base is described as typically taking six months to a year to complete before a breakout is considered. A measured-move objective is then described as a rise equal to the distance from the bowl floor to the lip after the breakout.
What counts as Breakout confirmation
Valid Breakout confirmation is described as a move above the lip on volume that at least doubles the low volume from the dip.
Among a 2005 top-10 list of stocks, seven names were retrospectively linked to this bowl-plus-breakout structure, and those breakouts occurred at 52-week highs. The archive also cites a pattern encyclopedia rating in which the rounded or bowl form was second-most likely to rise, with a 54% chance of a 20% or greater advance.
The NTRI sequence in the archive
On NTRI, the bowl is described as starting in March 2004 and completing in February 2005, when price broke a 52-week high near 4. A December 2004 profit turn and acquisition news first spiked volume more than price.
After that February 2005 breakout, NTRI is described as climbing to 44.15 in December 2005 and finishing the year at 36.02.
A short capture, not a long hold
The archive author prefers buying and selling the same name from the chart pattern with a more liberal Stop-loss order. The stated aim after the NTRI bowl breakout is to capture a quick 25% move rather than hold through later consolidations or market declines.
NTRI weekly: 2004 bowl, February 2005 lip break, then the 2005 run
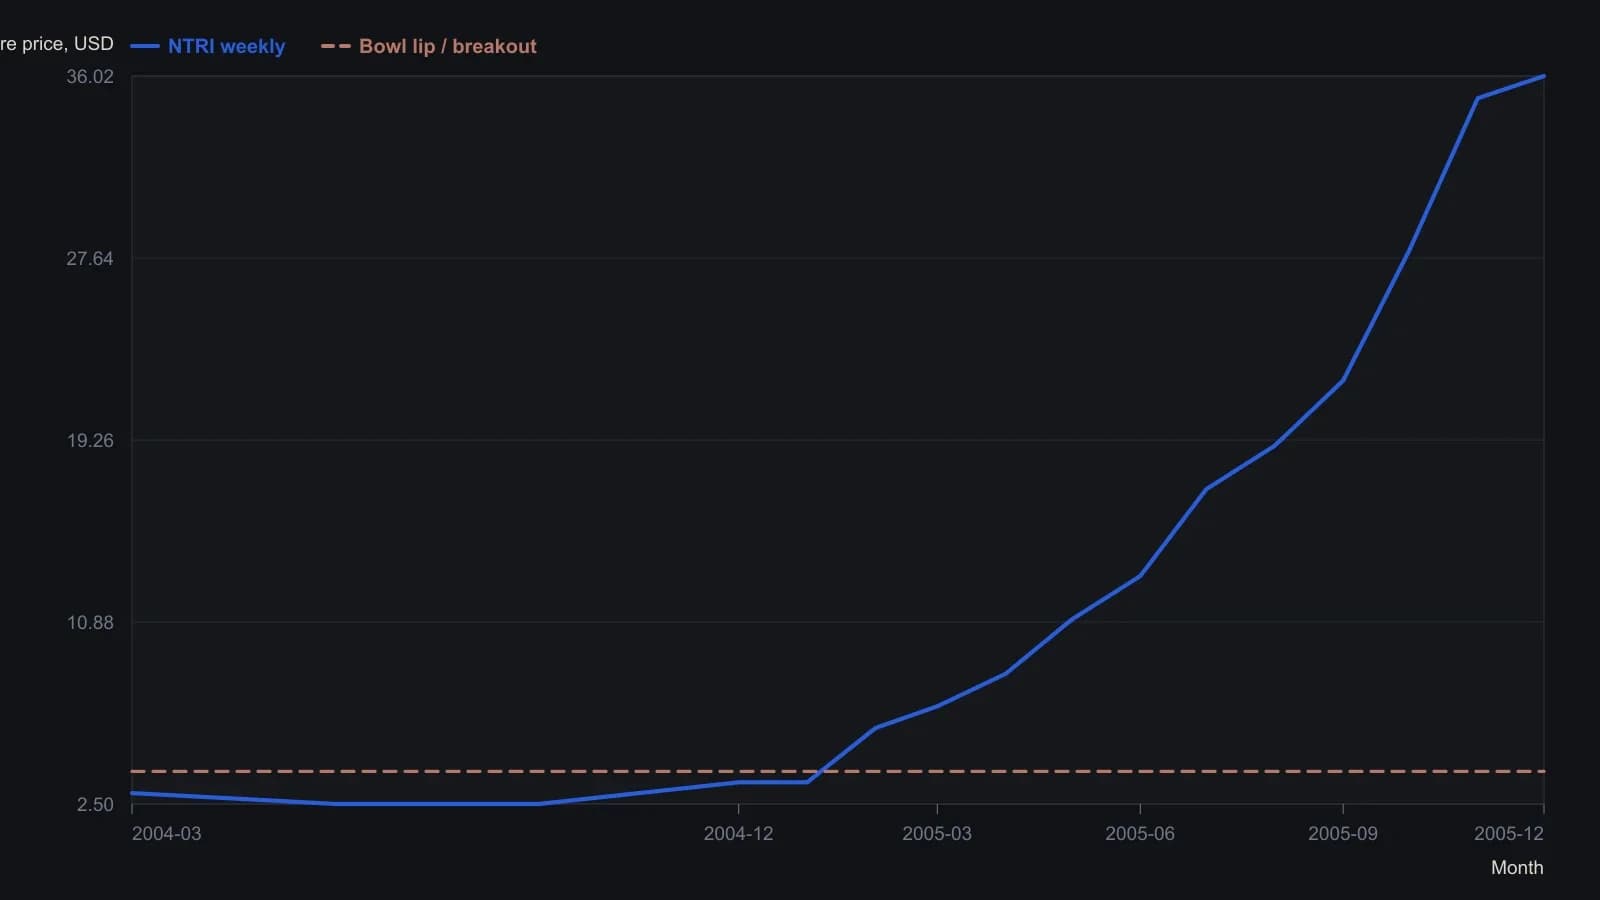
2004 points are sparse because those weekly candles sit in a tight band near the bottom of a roughly $0–45 scale. The flat $4 series is the printed breakout/lip level, not a fitted average. December’s $44.15 high is stated in the text and is not the year-end close.
All readings on this track · 14 readings
- 1990Constructing falsifiable reversal patterns from price structure
- 1995Cup-with-handle construction: confirm the cup, the handle, then the breakout
- 1995Cup-completion cheat before the handle breakout
- 1998Constructing rounded-bottom cups as testable entries
- 1999Rounded bottom landmarks, invalidation, and breakout rules
- 2003Constructing rounded bottoms, triangles, and pennants
- 2006A five-by-five grid that accepts or rejects a cup
- 2006NTRI and the 2005 bowl breakout case
- 2006Rounded-bottom screens, first-try breakouts, and Fibonacci retracements
- 2007Constructing rounded bottoms as multi-year bases
- 2011Early semi-cup construction from the left rim and base
- 2011Early rounded bottom recognition on a locked log-price grid
- 2013Rounded turns as slope-first trade hypotheses
- 2017Evaluating a rounded bottom as a testable payoff structure