2019issue C0238-41
Constructing a sell-relative-strength-index from the intrabar range ratio
The sell-relative-strength-index is a lookback average of each bar's absolute open-to-close range divided by that bar's high-to-low range, plotted against fixed bands so a sell-side reading can be compared with a conventional relative-strength-index.
- The sell-relative-strength-index averages the intrabar-range-ratio over a default 20-bar lookback, and a bar with a zero high-low range contributes a zero ratio so the average remains defined.
- Fixed levels at 0.38, -0.38, and 0, plus a near-zero band from -0.05 to 0.05, color the plot as buy, sell, or hold, so the construction itself encodes a three-state signal.
- The teaching premise is that later selloff size is related to previously accumulated profitable space, measured from the open-close span inside the high-low range.
- On the illustrated QQQ chart, the constructed oscillator and a conventional relative-strength-index do not always fire together, which makes the two constructions separately testable.
A lookback average of the intrabar range ratio
The sell-relative-strength-index is a lookback average of each bar's absolute open-to-close range divided by that bar's absolute high-to-low range. The per-bar building block is the intrabar-range-ratio: absolute close minus open, divided by absolute high minus low, with a zero result when the high-low range is empty.
A default lookback of 20 bars is specified for that average. A bar with a zero high-low range contributes a zero ratio so the average remains defined.
The teaching premise is that the size of a later selloff is related to the size of previously accumulated profitable space, measured from the open-close span inside the high-low range. A conventional relative-strength-index, an oscillator of up versus down closes over a defined lookback, is used here only as the comparison baseline for the constructed sell-side reading.
Fixed bands that encode buy, sell, and hold
The oscillator is drawn with fixed reference levels at 0.38, -0.38, and 0, plus a near-zero band from -0.05 to 0.05 used as a hold coloring rule. Positive readings are colored as buy, negative readings as sell, and values inside the near-zero band as hold, so the construction itself encodes a three-state signal.
The over-profit-line is a fixed horizontal band on that plot. A move through the band is the chart condition that defines a buy or sell hypothesis. The sell-relative-strength-index is the lookback average plotted against those bands so a crossing can be treated as a buy, sell, or hold condition.
Labeled events on the illustrated charts
On the illustrated daily gold-miners leveraged ETF chart, crossings of the over-profit-line are labeled as buy and sell events. A later consolidation is labeled as a hold once price stops making those crossings. Those labeled crossings, and the later hold during consolidation, are the breakout-confirmation events: a cross of the over-profit-line, or a later hold while price consolidates, treated as a repeatable chart event that can be checked against subsequent price rather than accepted as a forecast.
On the illustrated daily QQQ chart, the constructed oscillator and a conventional relative-strength-index do not always fire together. One labeled buy appears on the constructed line without a relative-strength-index confirmation. One labeled sell appears after relative-strength-index has already left an overbought zone.
A conventional relative-strength-index remaining below an overbought threshold on the same QQQ example is presented as a missed short hypothesis that the constructed oscillator still flags, which makes the two constructions separately testable.
NUGT daily SRSI versus the ±0.38 over-profit bands
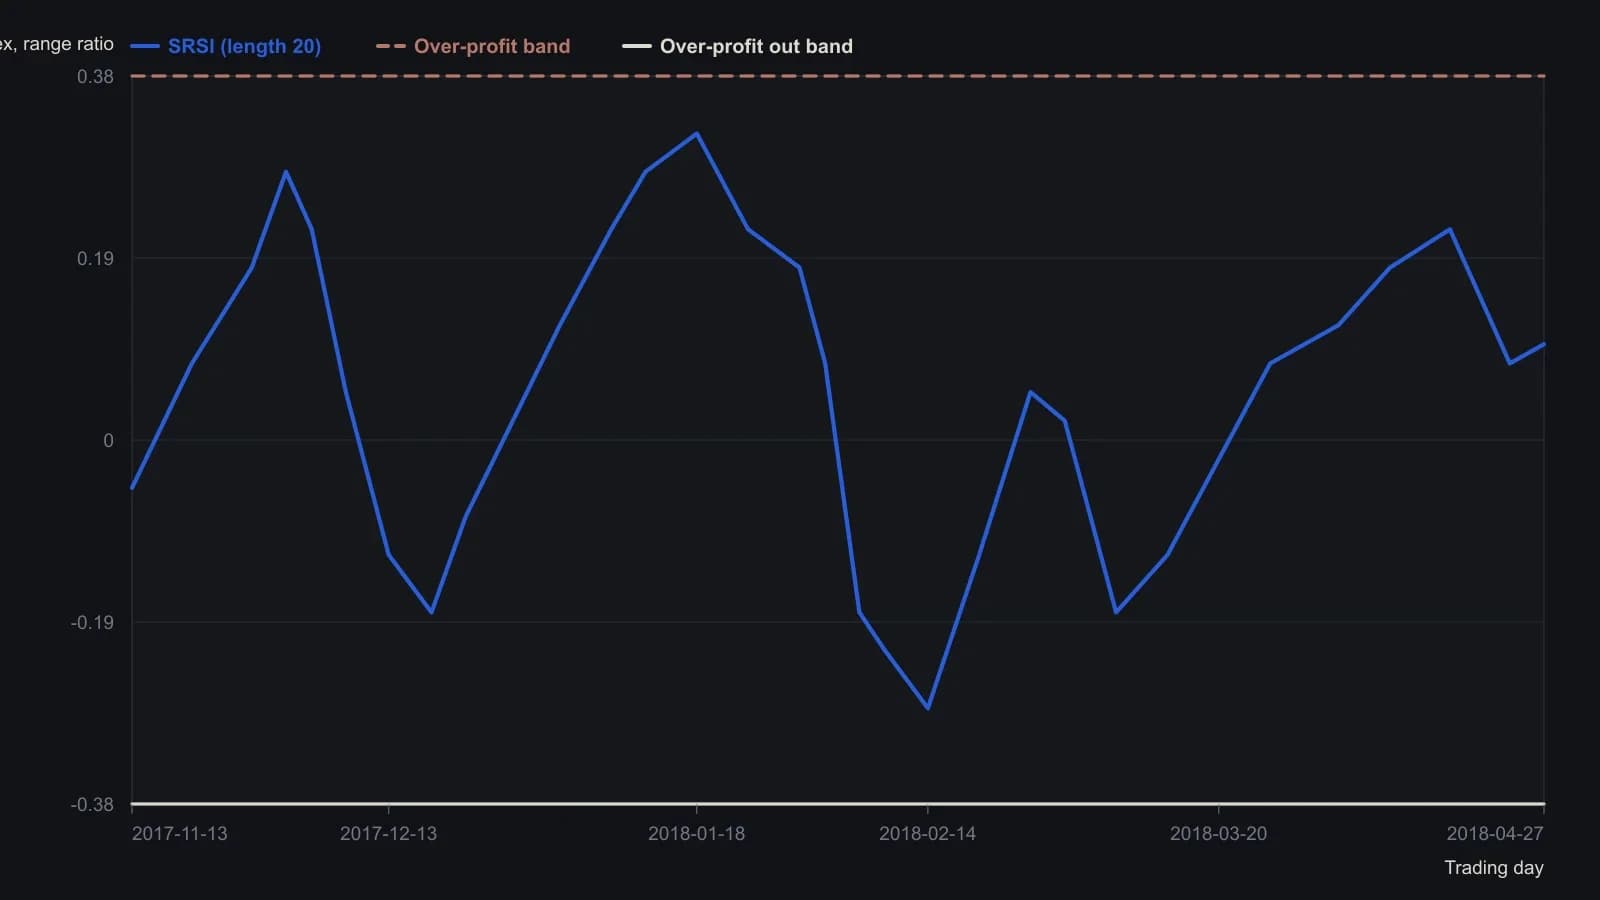
SRSI is a 20-bar average of abs(close−open)/abs(high−low); EasyLanguage also plots 0 and a yellow hold band at ±0.05. Digitized points are approximate because the source is a raster chart, not a numeric table.
All readings on this track · 20 readings
- 1982Constructing a funnel from converging support and resistance
- 1990Bond trends as auction tests at prior highs
- 1995Constructing mechanical trendline breakout entries
- 2000Crowd balance points before a range-breakout
- 2000Breakout rules fail without tested exits
- 2002Waiting for setups instead of forcing trades
- 2003The 20-day channel high as a support test after breakout
- 2004Intermediate-term breakout rules and fifty-day exits
- 2004A three-check drill for support and resistance
- 2004Weekly exponential averages turn from breakout rails to resistance
- 2005Constructing a three-state moving-average breakout histogram
- 2005A three-state directional breakout on a moving-average midline
- 2005A range-market breakout watchlist with 50-day pullbacks and stops
- 2009Optimism bias, breakout adds, and predefined loss limits
- 2015Refuse mixed-horizon entries until the checklist locks one persona
- 2017Intraday breakouts planned from whole-number support and resistance
- 2017A fractal-dimension regime-gate for mechanical breakout entries
- 2018Trend-first FX walls stay a hypothesis until a second touch, RSI recross, or failed break
- 2019Constructing a sell-relative-strength-index from the intrabar range ratio
- 2020Decluttered charts for breakout, support, and stop rules