2018issue C0524-28
Trend-first FX walls stay a hypothesis until a second touch, RSI recross, or failed break
Editorial classroom drill: map weekly currency floors and ceilings first, then withhold the idea until a second touch, a relative-strength-index recross of 70 or 30, or a failed range break closes back inside the prior zone.
- Currency zigzags label resistance at a prior high that later stalls an advance and support at a prior low that later stalls a decline, then apply role-reversal after a close through the line.
- After the trend is named, long ideas wait at support only in an uptrend and short ideas wait at resistance only in a downtrend. Fibonacci retracement is drawn only after that trend is identified.
- Entries wait for a level already touched at least twice, for relative-strength-index to recross 70 or 30 in a quiet range, or for a failed range break that closes back inside the prior zone.
- Higher-timeframe-priority maps weekly walls so lower-timeframe swings do not override the more significant highs and lows.
Map the weekly walls, then withhold the idea
Currency price paths are described as zigzags. A prior high that later stalls an advance is labeled resistance. A prior low that later stalls a decline is labeled support. Those horizontal floors and ceilings are the weekly wall map.
Editorial. TradersWeek treats that weekly map as a hypothesis, not an order. Combination analysis here is a withhold-until-confirmed classroom drill: the idea stays on the board until a second touch, a relative-strength-index recross of 70 or 30, or a failed range break closes back inside the prior zone.
Draw support and resistance from aligned swings
Resistance is drawn from two or more aligned candle highs with no higher high between them. A close above that line is treated as a long signal, with a stop placed above the broken resistance or, on a short, at the prior candle high.
Support is drawn from two or more aligned candle lows with no lower low between them. A close below that line is treated as a short signal, with a stop placed below the broken support or, on a long, at the prior candle low.
Role-reversal follows a close through the line. A broken resistance line is later treated as support, and a broken support line is later treated as resistance.
Psychological-round-number prices ending in two, three, or four zeros are treated as widely watched stalls. Four-zero endings are ranked as the strongest of those markers.
Take level ideas only with the named trend
After trend direction is named, long ideas are taken at support only in an uptrend and short ideas are taken at resistance only in a downtrend.
Fibonacci retracement is applied only after that trend is identified. It is drawn high-to-low in a downtrend and low-to-high in an uptrend. One daily downtrend example held at the 50.00 retracement as resistance. One daily uptrend example held at the 38.2 retracement as support.
Confirm with a second touch, an RSI recross, or a failed break
One four-hour example marked a resistance zone at 114.900 that reversed on three tests, while support was tested twice and the second test printed a pin bar. Entries are reserved for levels that have already been touched at least twice.
In a quiet range with usable distance between the walls, relative-strength-index is the wait filter. Shorts wait until the oscillator falls back through 70 rather than at first overbought. Longs wait until it crosses back up through 30 rather than at first oversold.
A breakout is a close through a mapped wall, or a failed push that leaves the range and then closes back inside. A failed range break that then closes back inside the prior resistance or support zone is treated as the range-trade trigger.
CHFJPY four-hour ceiling at 114.90 holds on three tests
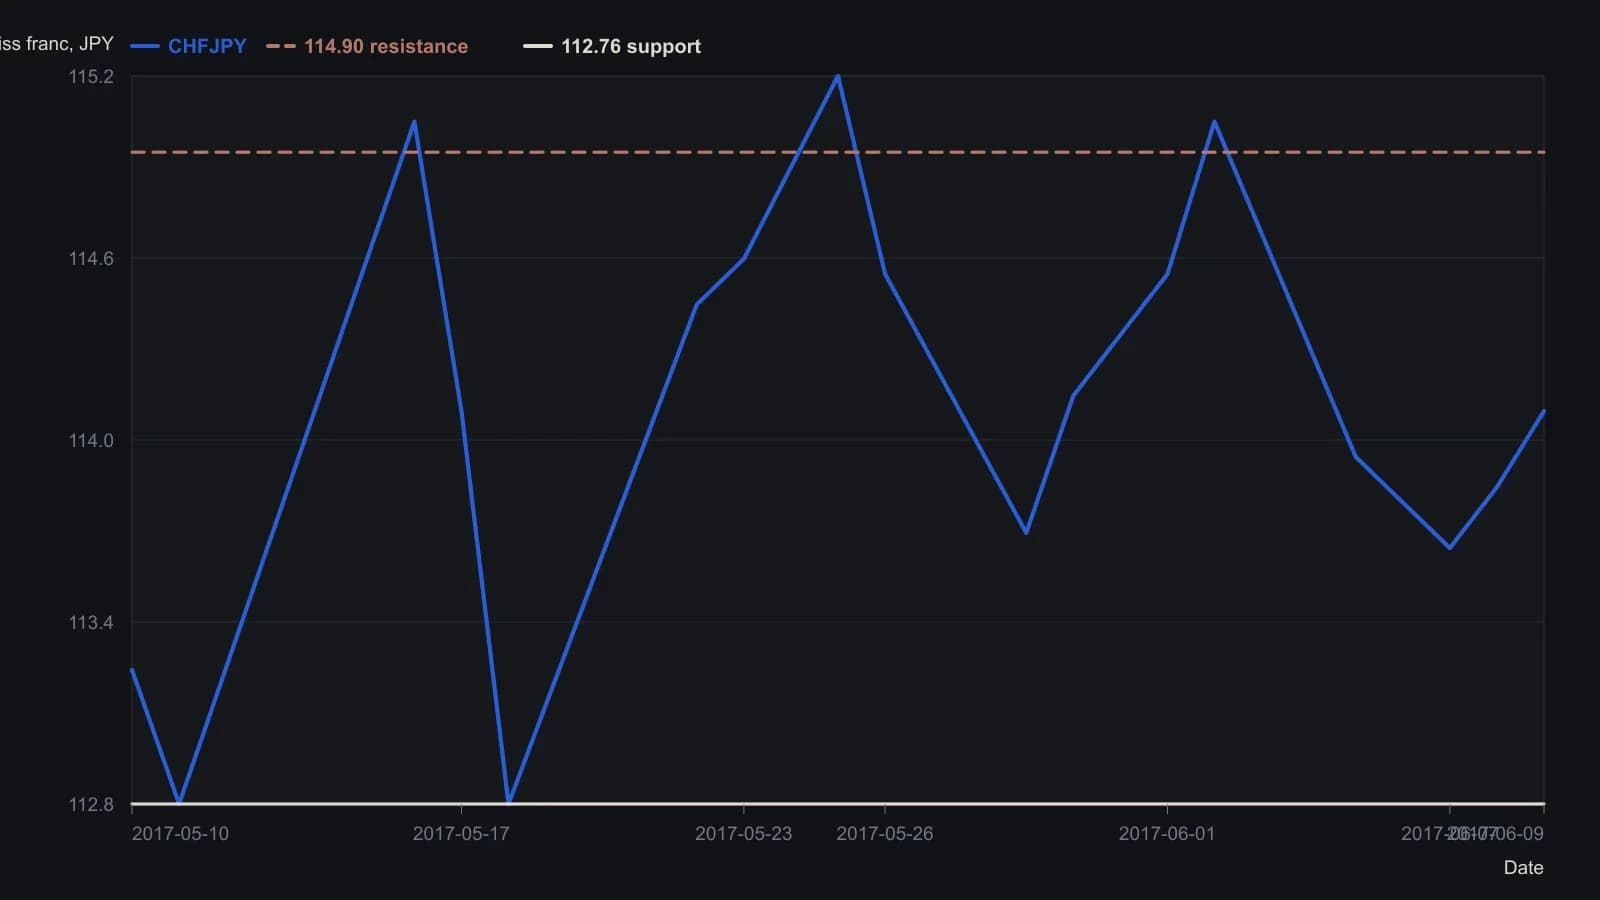
The article withholds the trade until a second stop at the wall; the second support test is the pin-bar rejection it treats as the signal. Touch highs and lows follow the platform lines at 114.998 and 112.762; 114.90 is the psychological figure given in the text. Intermediate closes are approximate reads off the raster, not a tick feed.
Keep weekly highs and lows in charge
Higher-timeframe-priority maps weekly walls on the larger chart so lower-timeframe swings do not override the more significant highs and lows. Higher-timeframe highs and lows are treated as more significant than the same structure on a lower timeframe.
Editorial. Until one of the three gates prints, the weekly wall remains a hypothesis. The second touch, the 70 or 30 recross, or the failed break that closes back inside is what turns that hypothesis into a classroom trade idea.
All readings on this track · 20 readings
- 1982Constructing a funnel from converging support and resistance
- 1990Bond trends as auction tests at prior highs
- 1995Constructing mechanical trendline breakout entries
- 2000Crowd balance points before a range-breakout
- 2000Breakout rules fail without tested exits
- 2002Waiting for setups instead of forcing trades
- 2003The 20-day channel high as a support test after breakout
- 2004Intermediate-term breakout rules and fifty-day exits
- 2004A three-check drill for support and resistance
- 2004Weekly exponential averages turn from breakout rails to resistance
- 2005Constructing a three-state moving-average breakout histogram
- 2005A three-state directional breakout on a moving-average midline
- 2005A range-market breakout watchlist with 50-day pullbacks and stops
- 2009Optimism bias, breakout adds, and predefined loss limits
- 2015Refuse mixed-horizon entries until the checklist locks one persona
- 2017Intraday breakouts planned from whole-number support and resistance
- 2017A fractal-dimension regime-gate for mechanical breakout entries
- 2018Trend-first FX walls stay a hypothesis until a second touch, RSI recross, or failed break
- 2019Constructing a sell-relative-strength-index from the intrabar range ratio
- 2020Decluttered charts for breakout, support, and stop rules