2004issue C091-2
Weekly exponential averages turn from breakout rails to resistance
A 2003 and 2004 group of Asia-focused closed-end country funds shows how 20-week and 50-week exponential moving averages first framed a shared breakout, then became a common resistance lid after both rails were lost.
- Four Asia-focused closed-end country funds can be read together on a weekly sampling interval using the 20-week and 50-week exponential moving averages.
- An India-focused fund closed through both averages in late spring 2003, then later reversed back through the same rails.
- China- and Thailand-focused funds lost the 20-week average first and the 50-week average later, after which both averages were treated as likely resistance.
- A Malaysia-focused decline was at least as severe as the contemporaneous corrections in the China-, India-, and Thailand-focused funds.
A shared weekly sampling interval
During 2003 and 2004, a China-focused, a Thailand-focused, an India-focused, and a Malaysia-focused closed-end country fund can be placed on the same weekly sampling interval. Each is an exchange-listed national equity basket, so the weekly close can be read with the same price structure as a single market.
On that horizon, a 20-week exponential moving average and a 50-week exponential moving average are recency-weighted averages of ordered weekly prices. They can mark a trend rail during an advance and later a resistance band after the rail is lost.
China and Thailand lose both rails
A China-focused closed-end country fund traded below 15 early in 2003 and above 45 by autumn. Late in December 2003 it traded below its 20-week exponential moving average. In spring 2004 it traded below its 50-week exponential moving average. After those losses, both averages were treated as likely resistance.
A Thailand-focused closed-end country fund began 2003 near 4 and neared 12 in January 2004. It then repeatedly traded below its 20-week exponential moving average and later traded below its 50-week exponential moving average by spring 2004.
An India-focused breakout and later reversal
An India-focused closed-end country fund broke above both its 20-week and 50-week exponential moving averages in late spring 2003. After that breakout the fund moved from nearly 10 to almost 30 by autumn 2003, briefly returned to the 20-week exponential moving average, attempted a new high, then reversed through the 20-week average and later the 50-week average.
Editorial reading: that late-spring weekly close through both rails is a breakout, a close that turns those boundaries into a testable trend hypothesis.
A Malaysia-focused decline in the same window
A Malaysia-focused closed-end country fund advanced from just above 3.50 in spring 2003 to over 7 by autumn, then declined below 5 by spring 2004. The decline was described as at least as severe as the contemporaneous corrections in the China-, India-, and Thailand-focused funds.
China Fund weekly closes lose the 20- and 50-week EMAs
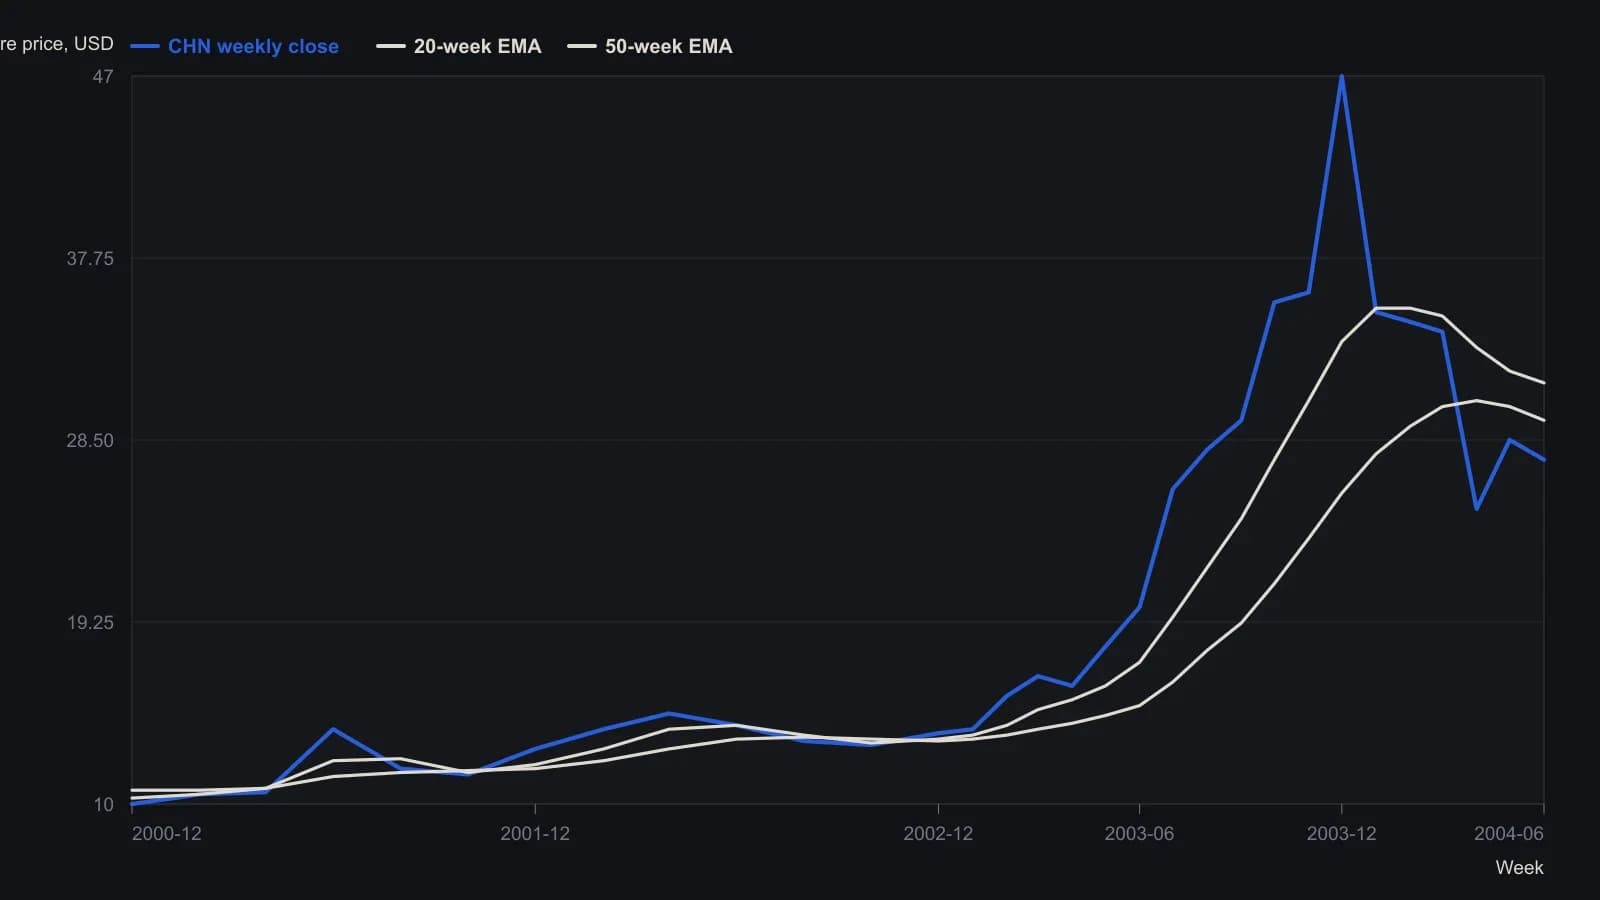
Points between the labeled last prints are monthly snapshots of the weekly candles and the two red EMA traces, rounded to the nearest 0.1. They are approximate. The final 27.50 / 31.40 / 29.50 trio matches the values printed on the source chart.
From trend rail to resistance band
Across the China-, Thailand-, and India-focused funds, the 20-week exponential moving average was lost before the 50-week average. Editorial reading: losing both rails is what flips the averages from a trend rail into a common resistance lid, a support and resistance zone where a later advance is expected to stall or reverse.
All readings on this track · 20 readings
- 1982Constructing a funnel from converging support and resistance
- 1990Bond trends as auction tests at prior highs
- 1995Constructing mechanical trendline breakout entries
- 2000Crowd balance points before a range-breakout
- 2000Breakout rules fail without tested exits
- 2002Waiting for setups instead of forcing trades
- 2003The 20-day channel high as a support test after breakout
- 2004Intermediate-term breakout rules and fifty-day exits
- 2004A three-check drill for support and resistance
- 2004Weekly exponential averages turn from breakout rails to resistance
- 2005Constructing a three-state moving-average breakout histogram
- 2005A three-state directional breakout on a moving-average midline
- 2005A range-market breakout watchlist with 50-day pullbacks and stops
- 2009Optimism bias, breakout adds, and predefined loss limits
- 2015Refuse mixed-horizon entries until the checklist locks one persona
- 2017Intraday breakouts planned from whole-number support and resistance
- 2017A fractal-dimension regime-gate for mechanical breakout entries
- 2018Trend-first FX walls stay a hypothesis until a second touch, RSI recross, or failed break
- 2019Constructing a sell-relative-strength-index from the intrabar range ratio
- 2020Decluttered charts for breakout, support, and stop rules