2000issue C061-6
Crowd balance points before a range-breakout
A long congestion can be treated as a waiting room whose support-resistance walls show how buyers and sellers revise their limits. Editorial reading: classify whether price still travels wall to wall or holds one boundary, so a later range-breakout confirms a mood shift that a balance-point already made testable.
- Markets and individual stocks are described as consolidating as much as 70 percent of the time, even when a larger uptrend is intact, and travel between ranges tends to be swift.
- As congestion lasts, would-be sellers lower limits and would-be buyers raise them inside the support-resistance walls, residual interest outside withdraws, and a range-vacuum forms just beyond the bounds.
- A balance-point sits only at the range high or low, when price stops returning from that boundary. Price-activity-classification of travel versus linger is the earliest sign that two-sided control has tipped.
- Editorial reading: treat a later range-breakout as confirmation of that mood shift, not as the first exhibit. Direction and catalyst stay unknown in advance, and the ensuing move is often sharp because opposing orders immediately beyond the range have thinned.
A range as a waiting room
An illustrated multi-month uptrend still spent most of that interval ranging or congesting. The archive generalizes that markets and individual stocks are in consolidation as much as 70 percent of the time, with travel between ranges tending to be swift.
Support-resistance is the pair of bounds on that congestion: the upper and lower edges that organize where holders and would-be buyers repeatedly place and then revise their limits. Editorial reading: treat those bounds as the walls of a waiting room, and treat the long range itself as a crowd-pressure laboratory rather than as dead time between trends.
Four settings and crowd-leadership
Crowd-like market behavior is described as appearing in four settings: an uptrend turning into euphoria, a downtrend turning into panic, and a long congestion breaking either upward or downward.
Three conditions are listed before crowd behavior is said to dominate: identifying with the group, accepting the group's rules and prevailing directional opinion, and accepting a leader. The archive assigns that leader role to price moving in an obvious direction. That last condition is crowd-leadership: an obvious directional move stands in for a group leader, and participants accept the prevailing opinion about that direction.
How limits migrate inside the walls
As a range lasts longer, would-be sellers are described as repeatedly lowering limits and would-be buyers as raising them. Deals then concentrate inside the range, and residual interest outside it withdraws.
After most of those residual orders have already been filled inside the congestion, sell interest immediately above the range and buy interest immediately below it thin out. That thinning is a range-vacuum. Editorial reading: the waiting room is still two-sided, but the hallway just outside each door is emptying.
Classify activity at one wall
A balance-point is located only at the top or bottom of a range. It is identified when price stops returning from that boundary, indicating a change in market mood even if the range is not drawn between parallel lines.
Price-activity-classification asks whether price still travels from one support-resistance wall to the other or has begun to linger at a single wall. That reading labels the change from two-sided to one-sided control. Editorial reading: repeated failure or acceptance at one wall is the earliest falsifiable sign that balance has already tipped.
Two sketches of a held wall
In a food-retailer case, after many months of oscillation, price fell from the range high for a fifth time, held the range low instead of rallying, then broke downward. It later formed another range that also broke downward with a sharp decline. The held low is the balance-point: two-sided travel had already failed before the range-breakout.
In a telecommunications case, after more than six months of swings off the range low, price reached the range high and did not fall back, creating a balance-point at the upper boundary. Editorial reading: the upper wall was accepted, so two-sided oscillation had already ended even while the range lines were still on the chart.
Read the range-breakout as confirmation
After prolonged two-sided trade, a clear break of the range high or low is presented as a sign that balance has tipped. The ensuing move is often sharp because opposing orders immediately beyond the range have thinned. That is the range-vacuum doing work after the fact.
The direction and catalyst of a range break are treated as unknown in advance. Listed possible triggers include earnings results, a major-house research note, large-participant buying or selling, or a product launch or withdrawal.
Editorial reading: a range-breakout confirms the mood shift already marked at the balance-point. It is not the first piece of evidence. Once price is moving in an obvious direction, crowd-leadership can take over as participants accept the prevailing opinion about that direction.
Hemköpskedjan B holds the lower wall of its late-1998 range
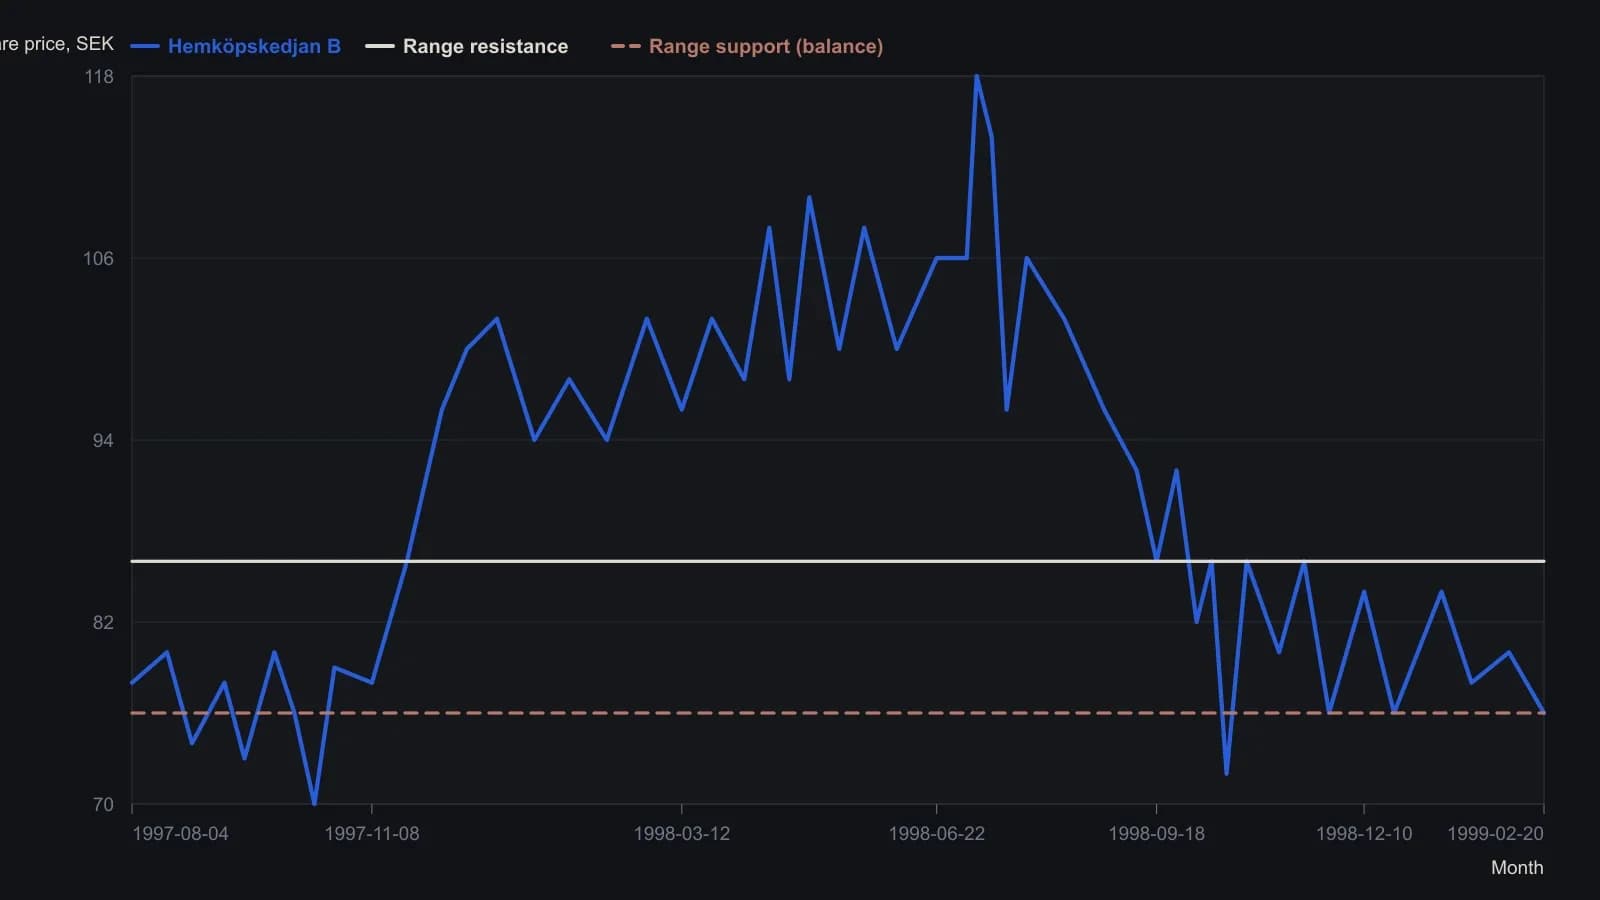
The source axis labels months only, so dates are placed early, mid, or late inside the labeled month. Prices are nearest-krona readings; the raster does not support finer precision.
All readings on this track · 20 readings
- 1982Constructing a funnel from converging support and resistance
- 1990Bond trends as auction tests at prior highs
- 1995Constructing mechanical trendline breakout entries
- 2000Crowd balance points before a range-breakout
- 2000Breakout rules fail without tested exits
- 2002Waiting for setups instead of forcing trades
- 2003The 20-day channel high as a support test after breakout
- 2004Intermediate-term breakout rules and fifty-day exits
- 2004A three-check drill for support and resistance
- 2004Weekly exponential averages turn from breakout rails to resistance
- 2005Constructing a three-state moving-average breakout histogram
- 2005A three-state directional breakout on a moving-average midline
- 2005A range-market breakout watchlist with 50-day pullbacks and stops
- 2009Optimism bias, breakout adds, and predefined loss limits
- 2015Refuse mixed-horizon entries until the checklist locks one persona
- 2017Intraday breakouts planned from whole-number support and resistance
- 2017A fractal-dimension regime-gate for mechanical breakout entries
- 2018Trend-first FX walls stay a hypothesis until a second touch, RSI recross, or failed break
- 2019Constructing a sell-relative-strength-index from the intrabar range ratio
- 2020Decluttered charts for breakout, support, and stop rules