2004issue C061-2
A three-check drill for support and resistance
Support and resistance are hypotheses drawn from troughs, peaks, trendlines, or moving averages. This case study restates a historical QQQ walkthrough and an editorial three-check drill: confirm a break with a close, demand a role-reversal retest, and tighten the stop-loss order before the test arrives.
- Editorial drill: require a close to confirm a break, demand a role-reversal retest after the breakout, and tighten the stop-loss order before the test arrives.
- Support sits below the market and resistance sits above it, marked from a prior trough, peak, trendline, or moving average as a level that has so far held.
- A close through the area is treated as a break; a bounce that holds is a successful test; a broken resistance area can later act as support on the first pullback.
- Tighter real or mental stops bound damage if the level fails, and a pause on a 15-minute chart may be a longer-horizon level on an hourly or daily chart.
Support below, resistance above
Support sits below the market. It can be marked from a prior trough, a moving average, or a trendline as a level a decline has so far failed to penetrate. Resistance is a ceiling above the market, often a horizontal or near-horizontal line across several tops, where selling is described as strong enough to interrupt or reverse an advance.
Support and resistance are a chart condition drawn from prior troughs, peaks, trendlines, or moving averages on open-high-low-close structure. They are used as a falsifiable hypothesis rather than a guaranteed wall.
The paragraphs that follow restate the historical workflow. The three-check drill is an editorial reading of that workflow, not a claim made by the archive.
The QQQ ceiling and the later stall
On the same QQQ chart, mid-October, early-November, and early-December rallies failed to close above 36 until late December, when buying finally carried prices through that ceiling.
In the mid-January 2004 QQQ decline from about 39, prices stalled near 36.25 where a 50-day exponential moving average coincided with a horizontal line from prior December and November peaks. That stall sat where the moving average met a horizontal line taken from those earlier peaks.
A close confirms a break
A close beneath support is treated as a break that lets the decline resume. A bounce that holds is treated as a successful test and an early sign the downtrend may be ending.
Breakout confirmation is a close through a prior support or resistance area. That close converts the old boundary into a new hypothesis on the opposite side of the market. Editorial reading: treat only a close through the area as breakout confirmation.
Role reversal on the first pullback
After prices break through a prior resistance area, that same level can later act as support on the first pullback. Role reversal is that tendency: a broken resistance area can act later as support on a pullback, or broken support can act later as resistance.
Editorial reading: after the breakout, the idea is not finished until that first retest either holds or fails.
Tighten the stop before the test
As price nears a support or resistance area, tighter real or mental stop-loss orders are presented as a way to bound damage if the level fails. A stop-loss order is a real or mental risk bound tightened as price approaches a nearby support or resistance test so a failed level stays a limited loss.
Editorial reading: place or tighten that bound before the test arrives, not after the level has already given way.
Longer charts and longer-lived areas
A pause that looks unexplained on a 15-minute chart may match support or resistance visible on an hourly or daily chart, and longer-horizon levels are treated as more powerful than shorter-horizon ones. Time-frame confirmation is that check of a longer chart horizon.
No indicator is offered that can measure how strong a support or resistance area will be. A longer-lived area is treated as more likely to hold.
QQQ daily: December resistance becomes February support
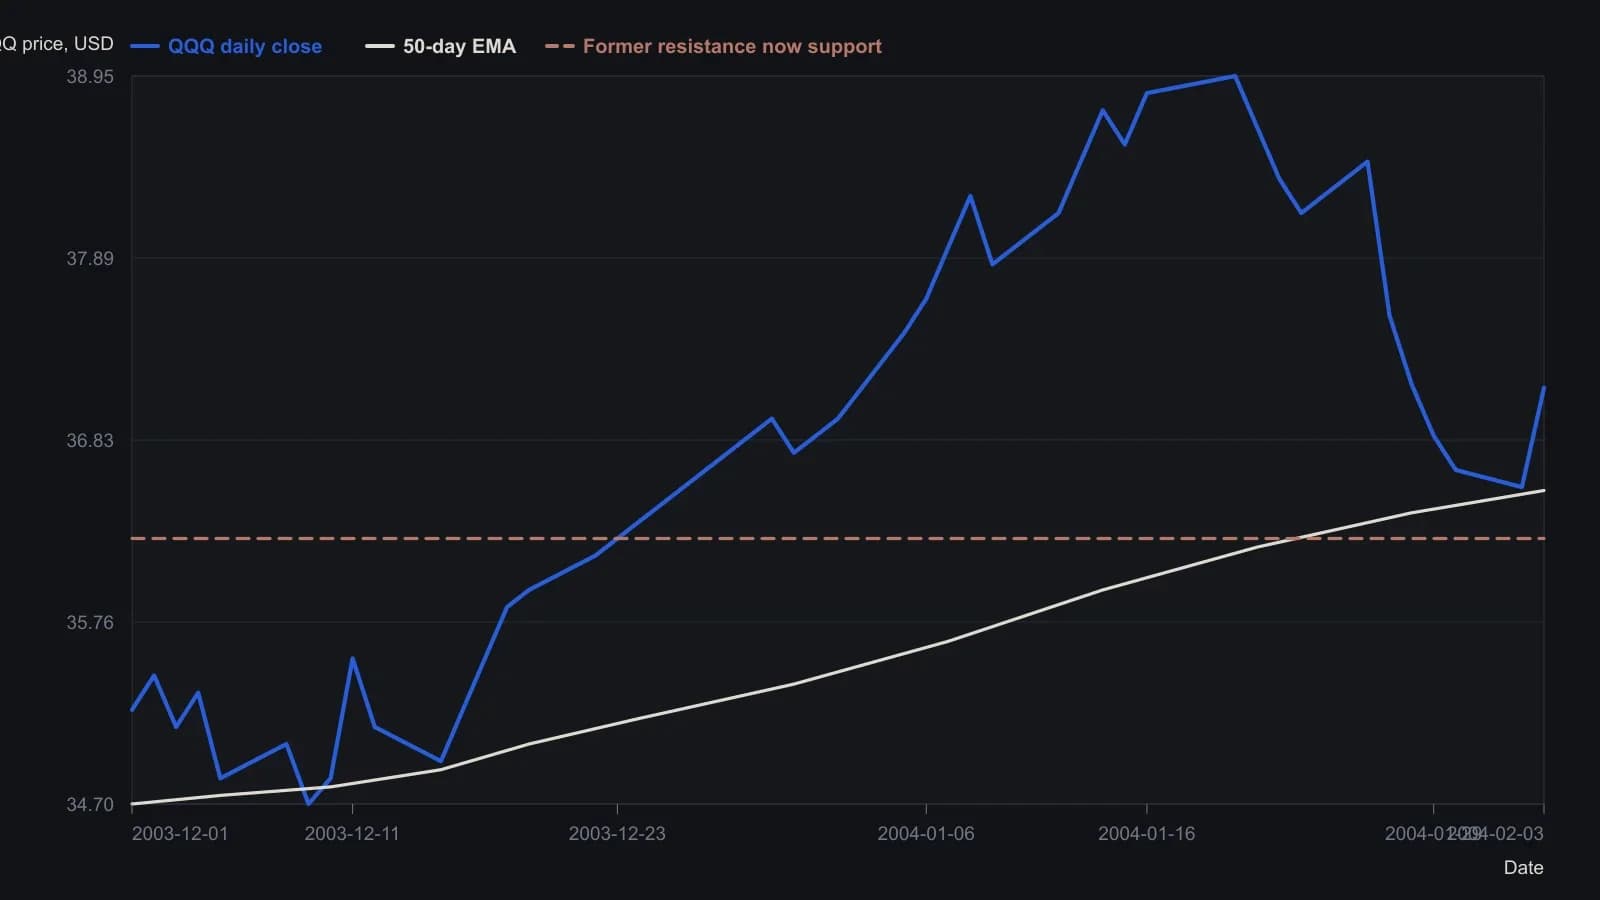
Closes and the EMA are approximate readings from the printed daily pane (about 0.10 accuracy). The $36.25 threshold is the level the article states, matching the horizontal line drawn on the chart near 36.53.
All readings on this track · 20 readings
- 1982Constructing a funnel from converging support and resistance
- 1990Bond trends as auction tests at prior highs
- 1995Constructing mechanical trendline breakout entries
- 2000Crowd balance points before a range-breakout
- 2000Breakout rules fail without tested exits
- 2002Waiting for setups instead of forcing trades
- 2003The 20-day channel high as a support test after breakout
- 2004Intermediate-term breakout rules and fifty-day exits
- 2004A three-check drill for support and resistance
- 2004Weekly exponential averages turn from breakout rails to resistance
- 2005Constructing a three-state moving-average breakout histogram
- 2005A three-state directional breakout on a moving-average midline
- 2005A range-market breakout watchlist with 50-day pullbacks and stops
- 2009Optimism bias, breakout adds, and predefined loss limits
- 2015Refuse mixed-horizon entries until the checklist locks one persona
- 2017Intraday breakouts planned from whole-number support and resistance
- 2017A fractal-dimension regime-gate for mechanical breakout entries
- 2018Trend-first FX walls stay a hypothesis until a second touch, RSI recross, or failed break
- 2019Constructing a sell-relative-strength-index from the intrabar range ratio
- 2020Decluttered charts for breakout, support, and stop rules