2005issue C021-6
Constructing a three-state moving-average breakout histogram
A moving average can be read as support-resistance. This construction records every bar that touches that average, encodes full clearance as an up or down state, and assigns an alert-state when the average cuts through the bar. A later breakout after a neutral-zone is treated separately from a single-bar close cross.
- Use the moving average as the baseline a bar must fully clear or merely intersect, not only as a close-versus-average trigger.
- Assign an up state when lows sit entirely above the average, a down state when highs sit entirely below it, and an alert-state when the average intersects any part of the bar.
- Treat a breakout after a neutral-zone as a different event from a single-bar close cross of the average.
- Pair the histogram with volume, a second average, or another overlay, because repeated range alerts and withheld higher-timeframe follow-through argue against using it as a standalone system.
Price contact with the average
A moving average can be used as support-resistance, so an intersection between price and that average is treated as a candidate trend-shift alert. The moving average is a chosen-length smoother of ordered prices that supplies the baseline a bar must fully clear or merely intersect.
A conventional forecast rule uses the close relative to the average at the moment of contact. A close above is taken to imply subsequent upside, and a close below subsequent downside.
This construction distinguishes that close-only reading from a fuller contact record. It records every bar in which any portion of the price range touches the average, regardless of the close, and stores direction immediately before and after that contact so the next move can be classed as continuation or reversal.
Three histogram states
An up state requires lows entirely above the average. A down state requires highs entirely below it. The histogram sits above zero in the first case and below zero in the second. Direction as support-resistance is granted only when those full-clearance tests hold.
The coded rule assigns histogram values of 2 when the current low is above the average, -2 when the current high is below the average, and a split 1 and -1 pair when the average intersects the bar. That split pair is the alert-state. It is assigned when the average intersects any part of the current bar, independent of the close.
Length defaults to 20, with a selectable source and average type. A color-on-price variant applies the same three-state rule to the bars themselves.
SPY directional-breakout histogram states, May–October 2004
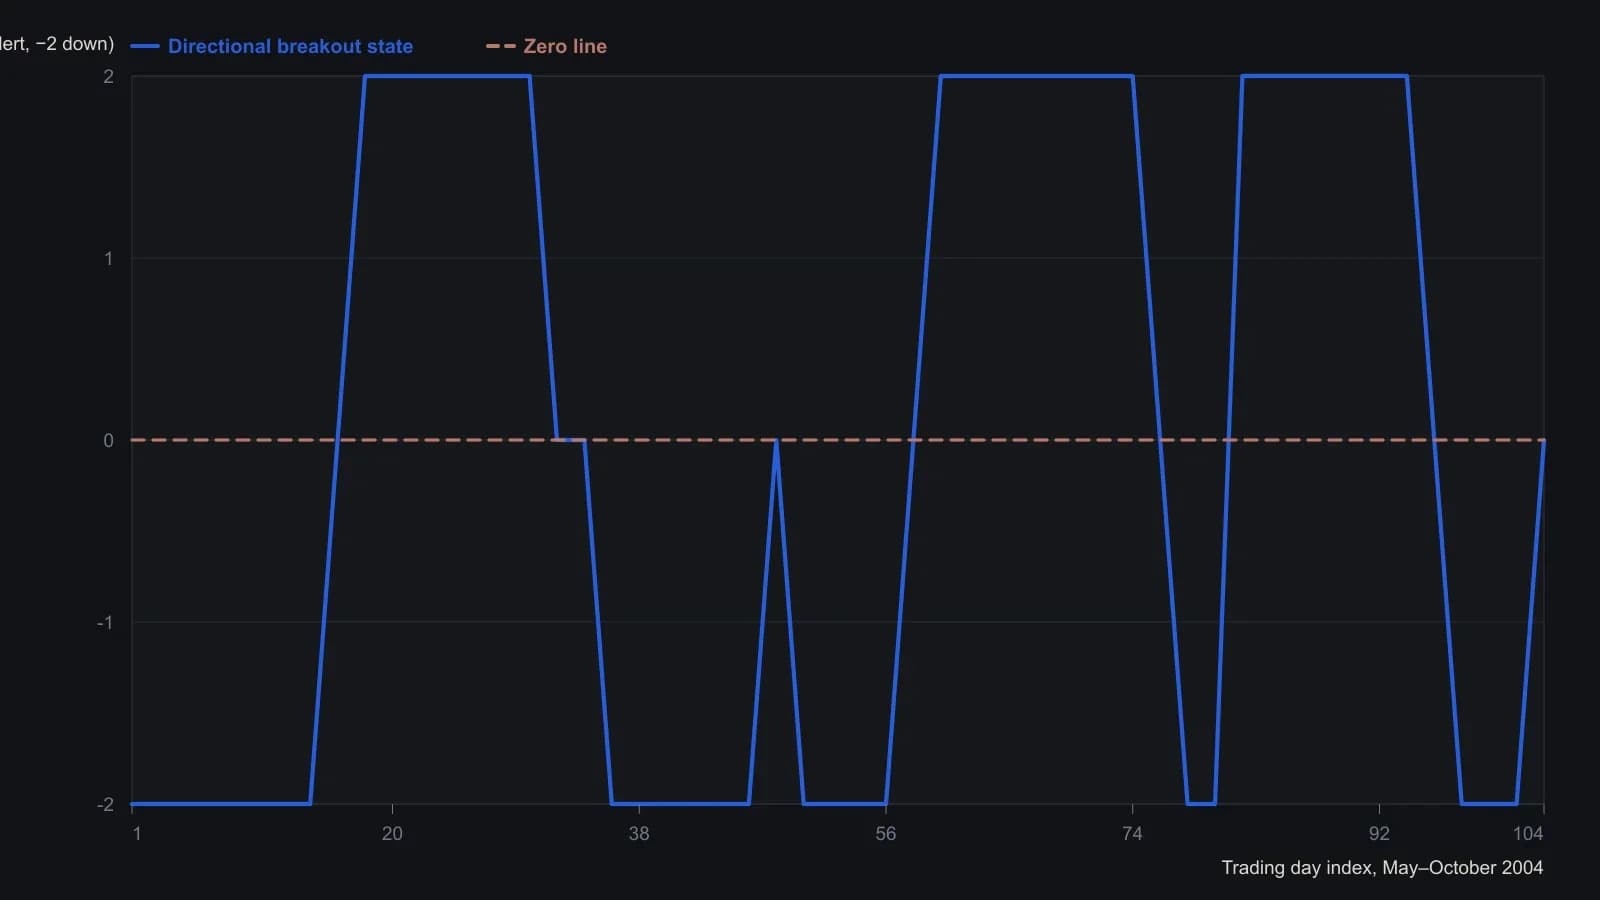
The source fixes a 20-period simple moving average on close. Histogram codes come from the published eSignal snippet: +2 when low is above the average, −2 when high is below it, and +1/−1 when the average intersects the bar. Digitized y-values are the discrete states, not interpolated prices. Point counts stay under 60.
A single-bar cross versus a neutral-zone
The construction distinguishes a single-bar close crossing the average from a later directional exit after the average cuts through two or more consecutive bars. That later stretch is the neutral-zone. It leaves direction unresolved until price emerges.
A breakout is a potential directional event marked when price leaves either a single-bar average cross or a multi-bar unresolved stretch.
Filters applied after an alert
Rising volume at an alert is presented as stronger conviction about the next direction. Declining volume is presented as leaving the subsequent breakout unresolved. The illustrated declining-volume alerts failed to hold the average as support-resistance.
A shorter-versus-longer average oscillator, illustrated at lengths 5 and 20, is offered as a confirmation layer. That layer can fail when a countertrend retrace exceeds about 25 to 30 percent of the prior swing.
Because the average lags, the construction is framed as an entry-oriented alert rather than an exit rule. An illustrated exit overlay uses a 14-period stochastic crossing its 20 or 80 thresholds. Sample entries are taken on the second bar after an alert.
Why the histogram is paired with other tools
Repeated alerts during a range, and a higher-timeframe chart that withheld downside follow-through, are used to argue that the histogram should be paired with confirming tools rather than used as a standalone system.
All readings on this track · 20 readings
- 1982Constructing a funnel from converging support and resistance
- 1990Bond trends as auction tests at prior highs
- 1995Constructing mechanical trendline breakout entries
- 2000Crowd balance points before a range-breakout
- 2000Breakout rules fail without tested exits
- 2002Waiting for setups instead of forcing trades
- 2003The 20-day channel high as a support test after breakout
- 2004Intermediate-term breakout rules and fifty-day exits
- 2004A three-check drill for support and resistance
- 2004Weekly exponential averages turn from breakout rails to resistance
- 2005Constructing a three-state moving-average breakout histogram
- 2005A three-state directional breakout on a moving-average midline
- 2005A range-market breakout watchlist with 50-day pullbacks and stops
- 2009Optimism bias, breakout adds, and predefined loss limits
- 2015Refuse mixed-horizon entries until the checklist locks one persona
- 2017Intraday breakouts planned from whole-number support and resistance
- 2017A fractal-dimension regime-gate for mechanical breakout entries
- 2018Trend-first FX walls stay a hypothesis until a second touch, RSI recross, or failed break
- 2019Constructing a sell-relative-strength-index from the intrabar range ratio
- 2020Decluttered charts for breakout, support, and stop rules