1994issue C031-13
Set the portfolio risk budget before you size
The archive sizes every new contract from one shared equity curve, then applies a per-trade fraction and a book-wide portfolio-risk-budget. Separate market ledgers understated the capital a six-market campaign actually required.
- A one-contract campaign across six markets from 1981 to 1991 produced about $197,204 of net profit and still left a late starter with a two-year loss of $5,027 after 120 signals.
- Portfolio-level-simulation showed a $29,619 joint drawdown, larger than the worst single-market drop, so a $25,000 one-market capital guess was too small.
- Volatility-position-sizing can raise a later cotton signal from one contract to two when a prior yen profit lifts the shared 2% risk budget above that market's stop distance.
- With a 2% per-trade cap and a 35% portfolio-risk-budget, days in the market fell from 2,632 to 1,974 and the longest drawdown shrank 56%, while peak percentage drawdown stayed about the same.
A late start could still exhaust a small account
A one-contract moving-average campaign across six markets from 1981 to 1991 produced about $197,204 of net profit. A trader who started after 1981 still recorded a two-year loss of $5,027 after 120 signals.
An account started with less than $5,000 at the beginning of 1982 would have been wiped out within two years, even though the same rules later showed $164,343 of net profit from 1982 through 1991. Variable-shift-testing re-runs the same rules after sliding the test window so start-date luck is not mistaken for robustness.
Stacked ledgers hid the joint drawdown
Simultaneous six-market testing produced a maximum drawdown of $29,619, larger than the worst single-market drawdown. A $25,000 guess based on one market understated the capital the joint book actually needed.
Adding closed-market results after the fact hides concurrent profit and loss. A $5,000 yen gain against a simultaneous $7,000 cotton loss still cuts the shared account by $2,000. Portfolio-level-simulation is a day-by-day test that applies every market signal against one shared equity curve instead of adding separate market results after the fact.
A drawdown-limit is a maximum allowable decline from peak equity used to judge whether the account is large enough to survive the plan. In the archive, the joint $29,619 figure is the scale that a one-market guess missed.
Japanese yen futures through the six-market test, 1981–1991
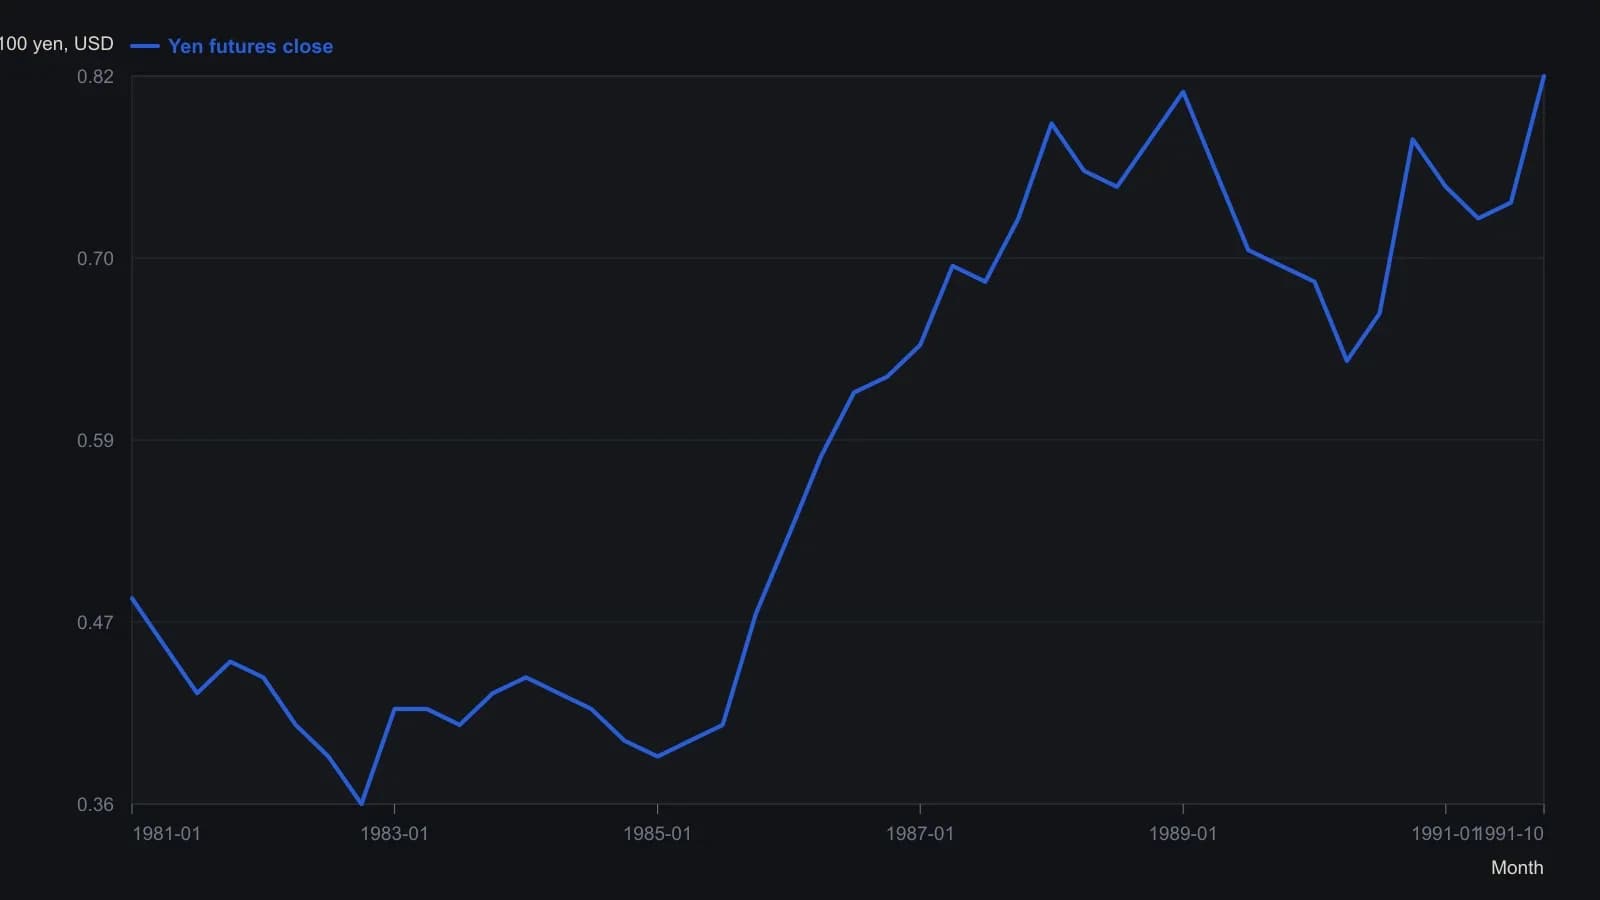
The figure caption calls the pane weekly, but the plot is stamped Monthly and shows about twelve bars per year. Closes were sampled quarterly from those monthly bars. Quote scale matches US dollars per 100 yen (0.40 ≈ 250 yen per dollar; 0.80 ≈ 125). Raster resolution does not support more than two decimal places.
Contract count follows the shared equity curve
A workable overlay used a $25,000 start, no more than 2% of equity risked on any one trade, and a 35% ceiling on total capital at risk across the book.
Volatility-position-sizing scales contract count from current equity, market volatility, and the distance to the stop so a single trade cannot spend more than a preset fraction of capital. Dynamic sizing from the shared equity curve can raise a later cotton signal from one contract to two when a prior yen profit lifts the 2% risk budget above that market's stop distance.
A portfolio-risk-budget is a hard ceiling on how much of current account equity may be at risk across all open positions at once. The archive overlay set that ceiling at 35% of capital.
What the two ceilings changed
With the 2% and 35% overlays, profitability rose 45%, days in the market fell from 2,632 to 1,974, and the longest drawdown shrank 56%, while peak percentage drawdown stayed about the same.
Even a 40% win rate still leaves roughly a 1-in-2,100 chance of losing more than half the account in the first 15 trades if more than 5% is risked per trade.
All readings on this track · 6 readings
- 1990Score drawdown depth and duration as a pain budget
- 1993Comfort before capital: walk the tape before you size
- 1994Set the portfolio risk budget before you size
- 2001Evaluate portfolio survival with value-at-risk, budgets, and scenarios
- 2002Set mixed-book share counts from one portfolio loss bound
- 2010Treat the pairs book as one risk budget before adding a layer