2015issue C078-11
Constructing price gravity and float turnover filters
This article sets out a construction test for chart levels in cash equity markets. A higher last-trade print is treated as a cash-raising event, and a prior high or low stays in the working set only after accumulated volume has turned the free float into a new owner group whose cost can be read with a volume-weighted average.
- A higher last-trade print requires a buyer to deliver more cash than the previous owner paid, while a lower print does not require the seller to raise new cash.
- When accumulated volume from a chart low reaches the free float, the share stock can sit with holders who never lived through that decline, which is used as a measure of emotional capacity.
- Prior support and resistance stay usable only up to the volume already accumulated, plus any self-reinforcing chart convention, with volume-weighted average price as a readout of current owners' cost.
- The construction is limited to cash equity markets with a relatively stable free float; listed derivatives are excluded because contract counts are not steady and time plays a larger role.
Printed prices and cash
A printed price is defined as the last completed trade, so a higher tape print requires a buyer to deliver more cash than the previous owner paid. Additional money is treated as a necessary precondition for prices to keep rising, but not a guarantee that they will. Falling prices do not require the seller to raise new cash.
Where the construction applies
The construction is limited to cash equity markets with a relatively stable free float and semi-zero-sum trading-cost effects. Listed derivatives are excluded because contract counts are not steady and time plays a larger role.
Price gravity
Price gravity is the cash asymmetry in which a higher last-trade print requires a buyer to commit more money, while a lower print does not require the seller to raise new cash. That cash asymmetry is offered as a logical account of why declines can unfold faster than advances and why conditional volatility can rise when returns fall.
Money flux and a nearly fixed share count
Completed trades relocate cash between counterparties rather than destroy it. A later sale at a lower price extracts a net cash amount from the market, described as money flux.
Aside from issuance and buybacks, share count is treated as nearly constant, and every share is always held by some owner, so transactions only transfer ownership.
Emotional capacity and accumulated volume
Free float is the stock of existing shares available for ordinary transactions in a cash equity market. Accumulated volume is a running sum of traded volume from a chosen low, compared with that free float to mark a possible full ownership transfer.
When running volume from a chart low reaches the free float, the available share stock can have moved into holders who never sat through that decline. That ownership reset is used as a measure of emotional capacity.
Support, resistance and owner cost
Volume-weighted average price is proposed as a readout of current owners' cost. Prior gaps or support and resistance are treated as usable only up to the volume that has already accumulated, plus any self-reinforcing chart convention.
Asymmetric variability on one decline
Asymmetric volatility is the tendency for measured variability to expand more when prices fall than when they rise. Average true range on one illustrated downswing from September 2012 to February 2013 is used to show measured variability expanding on the decline rather than on the prior advance.
AAPL last price from the 2012 high through the 2013 float-turnover range
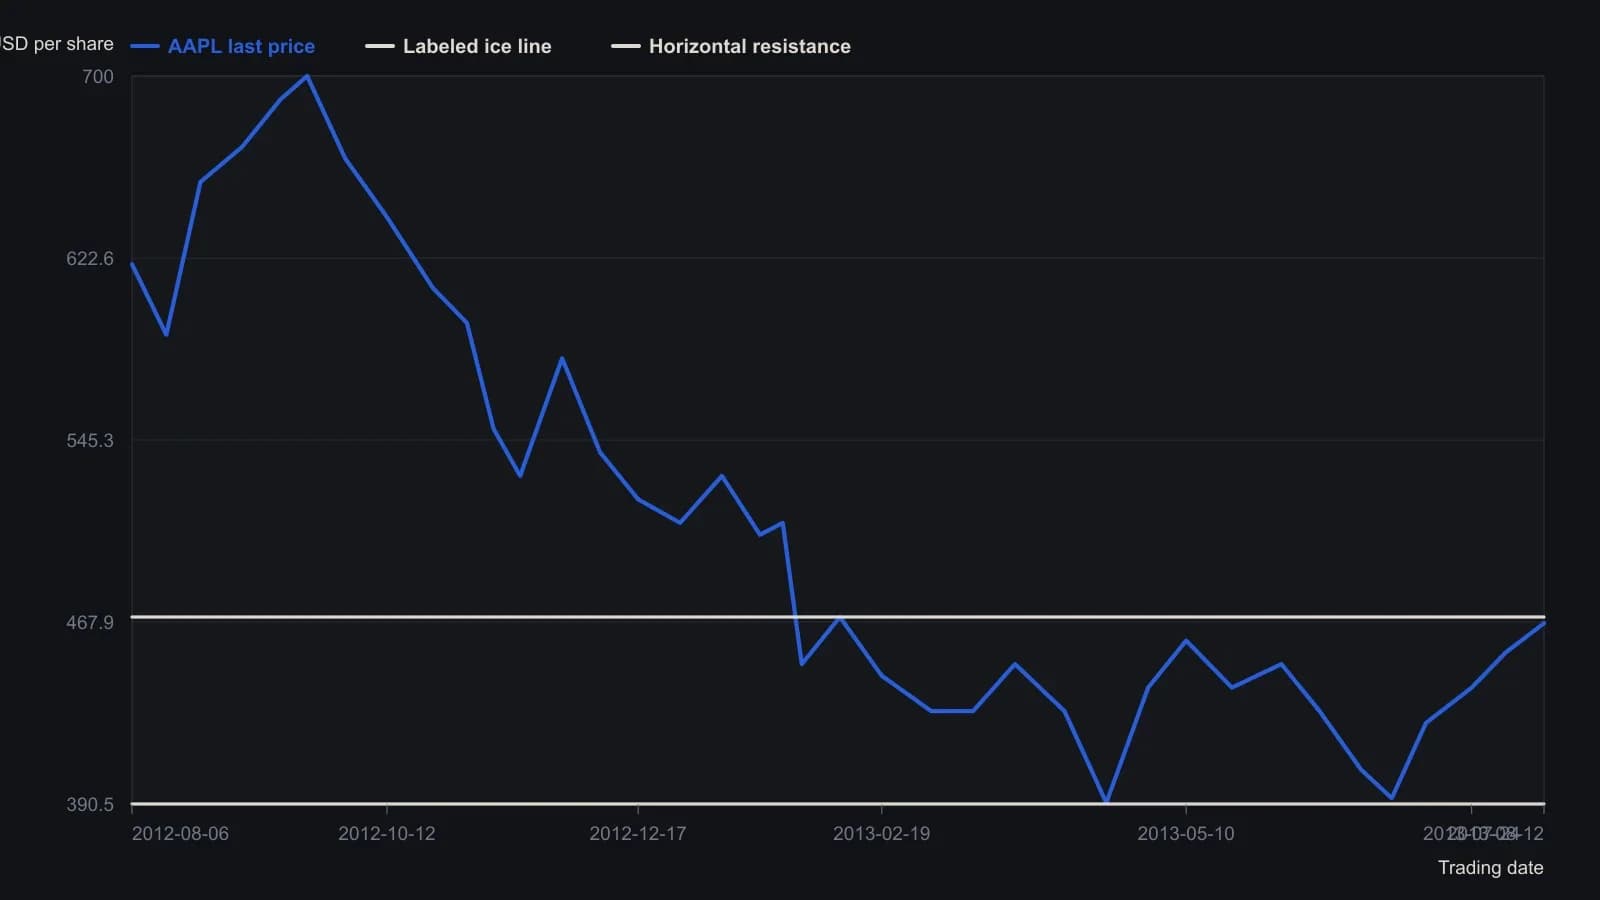
Pre-split US dollars. Daily candles were sampled at turning points and about every two weeks, so the path is approximate and should not be treated as a tick-for-tick extract.
All readings on this track · 18 readings
- 2000Volume-weighted average price as a baseline for indicator construction
- 2001Constructing VWAP support and resistance from cumulative volume
- 2001An elastic volume-weighted moving average from a share-count lookback
- 2001Constructing an elastic volume-weighted average and volatility bands
- 2004Volume-weighted column averages and crossovers on point-and-figure charts
- 2004Session volume-weighted average for limit placement and listed routing
- 2008Building MIDAS curves from an anchored volume-weighted average
- 2008Construct a launch-point VWAP as support and resistance filters
- 2014Workstation order routing, VWAP, and session filters
- 2015Constructing price gravity and float turnover filters
- 2015Constructing four-stage cycles with anchored VWAP
- 2017Constructing a volume-weighted crossover and breakout as one swing rule set
- 2017Constructing a volume-weighted moving-average crossover
- 2017Constructing anchored volume-weighted average price maps for crowd-visible execution costs
- 2018Order book heatmaps, VWAP, and flow for execution
- 2018Constructing futures rolls ahead of first notice day
- 2019Evaluate a mechanical futures system as one procedure
- 2020Every bounce is a falsifiable regime test