2004issue C051-3
Volume-weighted column averages and crossovers on point-and-figure charts
Each point-and-figure column can be reduced to a single volume-weighted average. A shorter-column average and a longer-column average of that series can then be overlaid on the same grid and compared with a later trendline breach.
- A point-and-figure chart starts a new column only after a reversal of a set box count, so the horizontal axis is event-driven rather than time-driven.
- Each column can be reduced to an equal-weight midpoint or to a volume-weighted average that gives more influence to prices that traded more size.
- The intended signal is the crossover of a shorter-column average and a longer-column average, not the exact box those averages occupy.
- In the illustrated five-column versus ten-column overlays, those crosses marked candidate entries and exits earlier than the matching trendline breach, including one case in which the trendline was never broken.
A grid that moves with reversals
A point-and-figure chart is a grid of alternating rising and falling columns. A new column starts only after a reversal of a set box count, so the horizontal axis is event-driven rather than time-driven.
Box size sets how much price must move to print a new square. A one-point box records more detail and reacts more quickly than a two-, three-, or five-point box.
One price for each column
Each print inside a column has an associated volume, so the column can be reduced to one number either as an equal-weight midpoint or as a volume-weighted average that gives more influence to prices that traded more size.
That volume-weighted average price multiplies each print by its volume and divides by total column volume. The result is the column-weighted average used in place of an equal-weight midpoint.
In the four-print rising-column illustration at 15, 16, 17, and 18 with volumes 5000, 20000, 500, and 1000, the equal-weight mean is 16.5 while the volume-weighted mean is 15.91 because most volume sat at the lower prints.
Averages on the same grid
A simple moving average of successive column volume-weighted means is a volume-weighted moving average on the point-and-figure chart. An exponential version of the same series applies a column-count weighting factor so recent columns count more.
Because the chart is a grid, each average value can be placed at the center, top, or bottom of the box it falls in. Placement must stay consistent because the intended signal is the crossover of two averages, not the exact box coordinate.
A moving-average crossover on this chart is the shorter-column average crossing the longer-column average. The intended comparison is the relative order of the two lines, not the exact box they occupy.
Crossovers and trendline breaches
In the illustrated five-column versus ten-column overlays, the average crosses marked candidate entries and exits earlier than the matching bullish or bearish trendline breach, including at least one case in which that trendline was never broken.
The worked overlays used five-column and ten-column exponential averages. Those lengths are a working default. Other column counts can be tried.
A trendline breach is a later, geometry-based confirmation that waits for price to cross a bullish or bearish line drawn on the same grid.
IBM 5- and 10-column EMAs on the point-and-figure grid
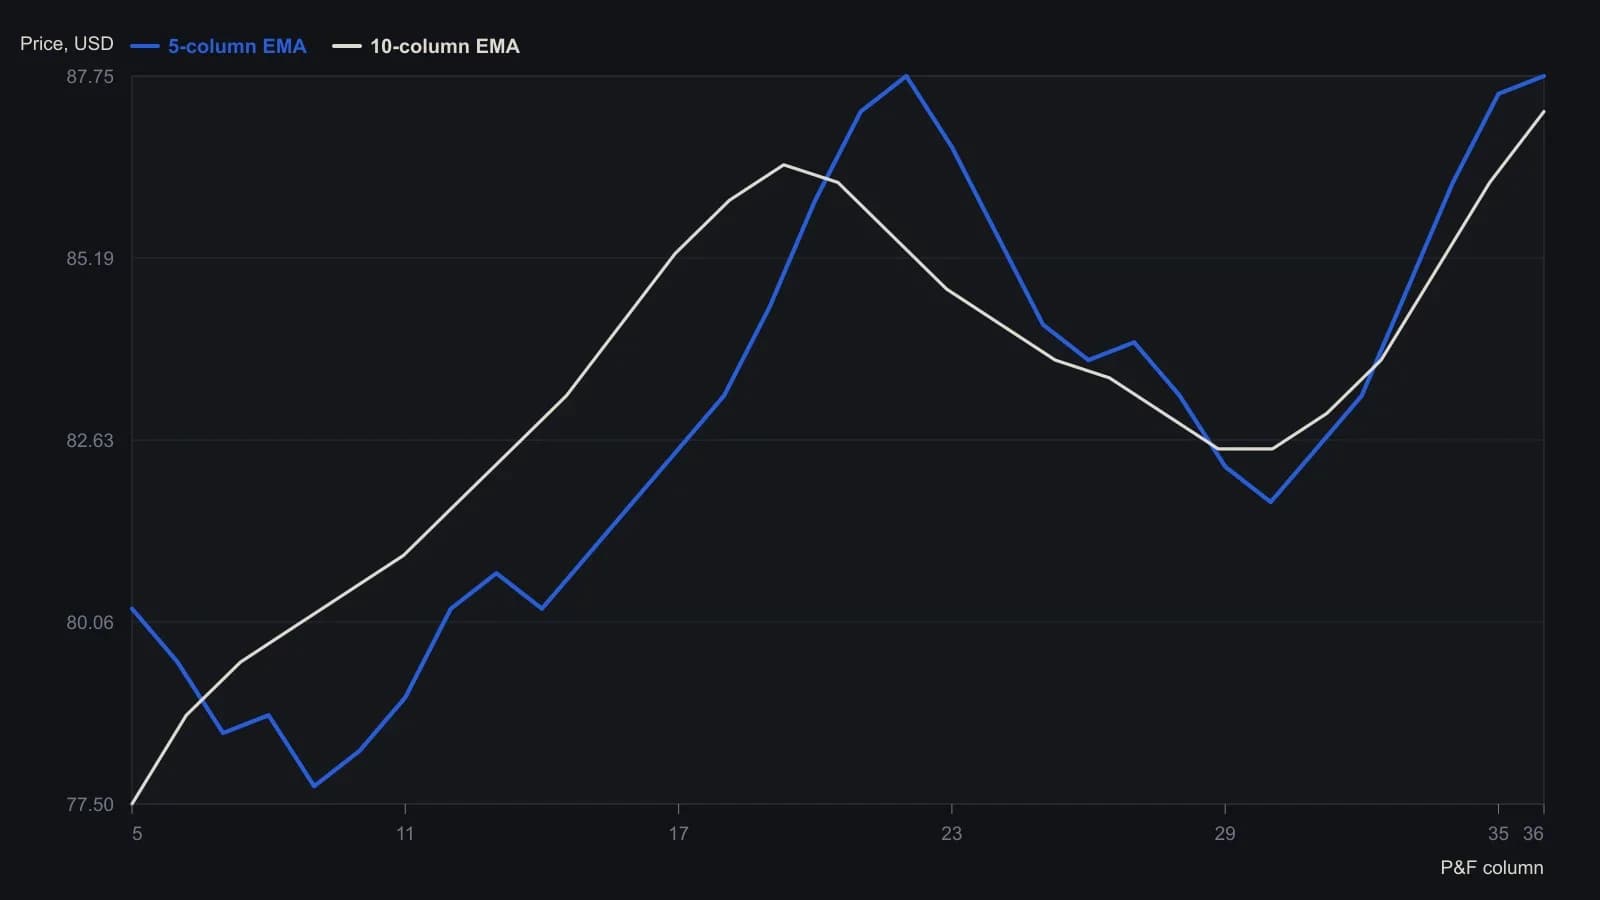
Source used closing prices, box size $0.25, three-box reversal, no vertical scaling, and exponential averages of 5 and 10 columns. Values were read from the printed grid to the nearest quarter-dollar and are not the original computed averages.
All readings on this track · 18 readings
- 2000Volume-weighted average price as a baseline for indicator construction
- 2001Constructing VWAP support and resistance from cumulative volume
- 2001An elastic volume-weighted moving average from a share-count lookback
- 2001Constructing an elastic volume-weighted average and volatility bands
- 2004Volume-weighted column averages and crossovers on point-and-figure charts
- 2004Session volume-weighted average for limit placement and listed routing
- 2008Building MIDAS curves from an anchored volume-weighted average
- 2008Construct a launch-point VWAP as support and resistance filters
- 2014Workstation order routing, VWAP, and session filters
- 2015Constructing price gravity and float turnover filters
- 2015Constructing four-stage cycles with anchored VWAP
- 2017Constructing a volume-weighted crossover and breakout as one swing rule set
- 2017Constructing a volume-weighted moving-average crossover
- 2017Constructing anchored volume-weighted average price maps for crowd-visible execution costs
- 2018Order book heatmaps, VWAP, and flow for execution
- 2018Constructing futures rolls ahead of first notice day
- 2019Evaluate a mechanical futures system as one procedure
- 2020Every bounce is a falsifiable regime test