2001issue C051-5
Constructing VWAP support and resistance from cumulative volume
Lock a volume-backed start date and accumulate midpoint price times size against cumulative volume. The resulting curve is the planned support or resistance region, not a line drawn after the move.
- A session volume-weighted average price is the size-weighted mean of traded prices. A daily approximation multiplies each day's midpoint price by volume and divides the change in that product by the change in cumulative volume.
- The intended start date is a breakout from consolidation on heavy volume, because that print marks a change in who is willing to own the stock.
- Support and resistance use the same ratio. Only the locked origin changes, so several curves can share one average-price versus cumulative-volume chart.
- The curve is a candidate reversal location. An observed bounce and a check of move strength are still required before a position is considered.
Start from the session average
A session volume-weighted average price is the sum of each trade's price times its size, divided by that session's total traded size. That size-weighted mean is used both as an execution benchmark and as the input that later builds a support or resistance curve.
One institutional benchmark treats a long fill below that day's volume-weighted average price as relatively favorable and a long fill above it as relatively weak. The comparison is reversed for shorts.
Replace trades with the daily midpoint
A daily approximation multiplies the high-low midpoint by that day's volume and divides the running sum of those products by the change in volume from a chosen start date. Midpoint price is half the session high plus low. It is the price input inside the price-volume product, used instead of the close.
The constructed support value from today back to a start date equals the change in cumulative midpoint-times-volume divided by the change in cumulative volume over that same window. Resistance uses the same ratio as support. Only the locked start date changes.
Lock the origin at a volume-backed breakout
After price leaves a consolidation on heavy volume, that breakout is the intended origin for later VWAP support and resistance curves, because it marks a change in who is willing to own the stock. Volume-price analysis judges that breakout by how much volume created the new average, not by the close alone.
Holders sitting on a loss become most eager to sell as price returns toward their purchase area. An accumulator who paid up often waits to add again near the average price where the campaign began. Editorial: that inventory behavior is why a locked VWAP origin is read here as support and resistance, rather than as a hand-drawn swing line.
Keep one start date in the spreadsheet
In a spreadsheet, the origin row is fixed with an absolute reference so each later row recomputes one continuous curve from the same start. Cumulative volume is the running total of daily volume from that start date. It is the denominator of the curve and the horizontal axis when the chart is taken off calendar time.
Several curves can be launched from notable lows and highs so multiple candidate bounce regions sit on one average-price versus cumulative-volume chart.
Constructed VWAP resistance from a locked 1 September 2000 origin
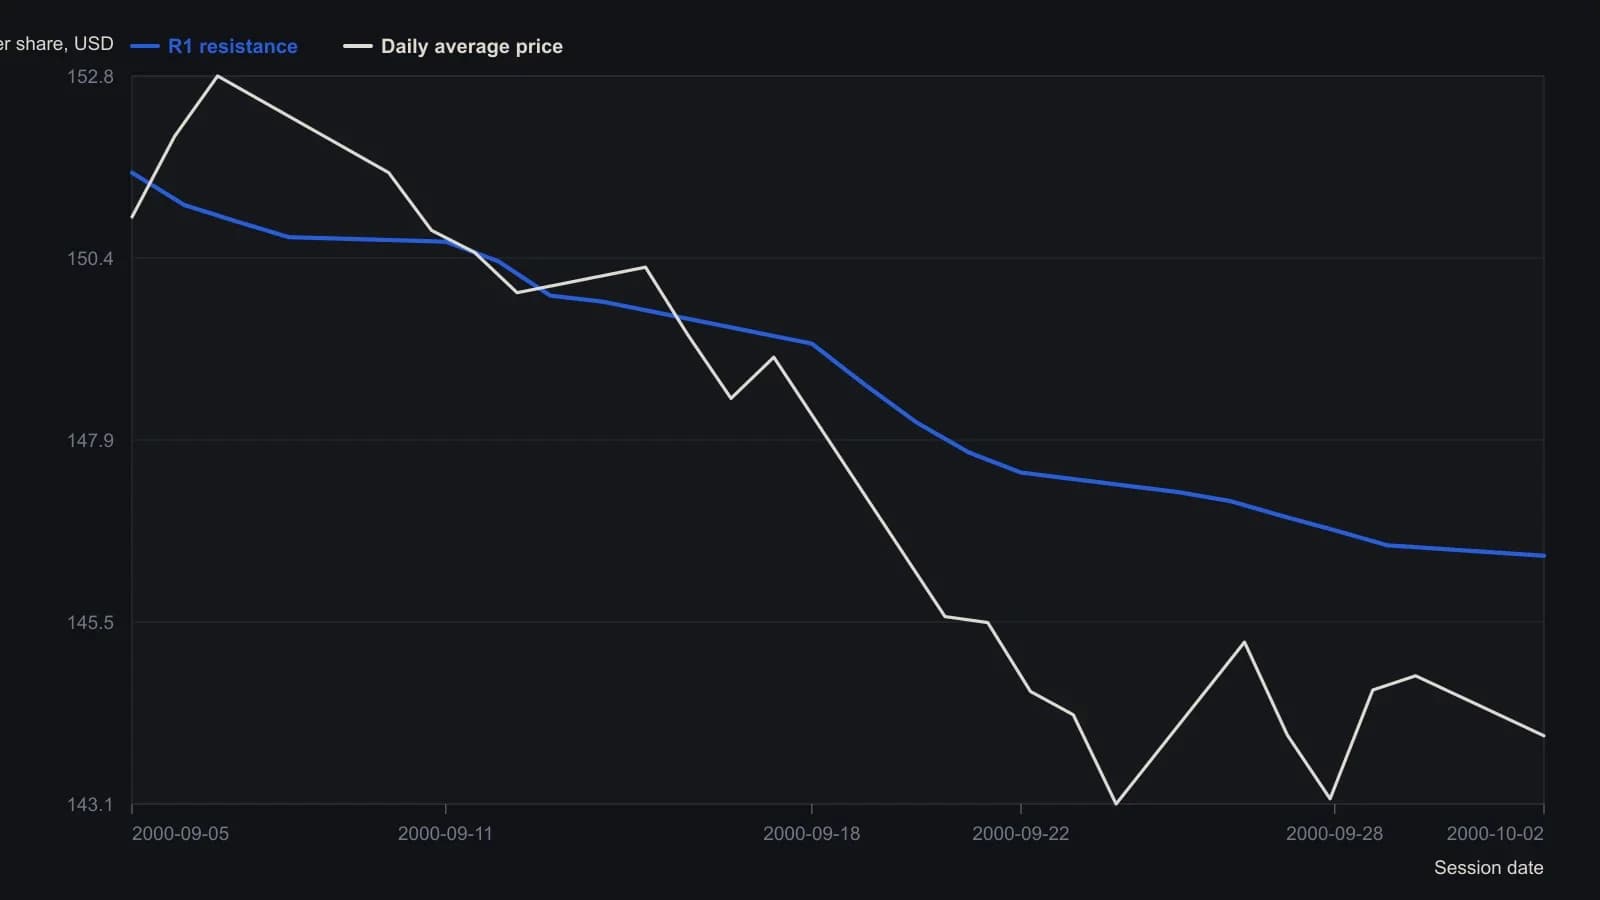
The worksheet freezes 1 September 2000 with an absolute cell reference. Price is falling, so the S1/R1 column is a resistance (R1) series.
Treat the curve as a candidate location
The curve is treated as a candidate reversal location that still requires an observed bounce and a check of move strength before a position is considered.
Editorial: the construction produces a planned region. It does not, by itself, decide that price will reverse or that a fill is justified.
All readings on this track · 18 readings
- 2000Volume-weighted average price as a baseline for indicator construction
- 2001Constructing VWAP support and resistance from cumulative volume
- 2001An elastic volume-weighted moving average from a share-count lookback
- 2001Constructing an elastic volume-weighted average and volatility bands
- 2004Volume-weighted column averages and crossovers on point-and-figure charts
- 2004Session volume-weighted average for limit placement and listed routing
- 2008Building MIDAS curves from an anchored volume-weighted average
- 2008Construct a launch-point VWAP as support and resistance filters
- 2014Workstation order routing, VWAP, and session filters
- 2015Constructing price gravity and float turnover filters
- 2015Constructing four-stage cycles with anchored VWAP
- 2017Constructing a volume-weighted crossover and breakout as one swing rule set
- 2017Constructing a volume-weighted moving-average crossover
- 2017Constructing anchored volume-weighted average price maps for crowd-visible execution costs
- 2018Order book heatmaps, VWAP, and flow for execution
- 2018Constructing futures rolls ahead of first notice day
- 2019Evaluate a mechanical futures system as one procedure
- 2020Every bounce is a falsifiable regime test