2020issue C0640-44
Every bounce is a falsifiable regime test
Classify the surrounding trend first, then ask whether a leadership head-and-shoulders break and repeated volume-weighted-average-price failures already disprove a dip-buying hypothesis. The archive treats a short bounce inside a primary decline as a different regime from a multi-year advance.
- Market-regime classification comes first: a short bounce inside a primary decline is a cyclical trend, not a secular trend.
- Until new all-time highs appear, a rebound after a drop of 20% or more from a prior high is still treated as cyclical rather than secular.
- A head-and-shoulders neckline break on a leadership chart is a warning that the broader advance may be weakening.
- Repeated breaks of five-day volume-weighted average price support can falsify a dip-buying hypothesis while the bounce is still only a bear rally.
Read the bounce as a test, not a verdict
This editorial article treats every bounce as a falsifiable regime test. Market-regime classification comes first: sort the surrounding move as a secular trend or a cyclical trend, and as bull or bear, so one rebound is read against the primary trend rather than in isolation.
The archive workflow then asks whether a leadership head-and-shoulders and repeated volume-weighted-average-price failures already disprove a dip-buying hypothesis. TradersWeek editorial reading: do not treat the pop as a new primary advance while those checks still reject the bounce.
A short bounce is not a secular trend
Cyclical phases are described as lasting weeks to months in typical cases, while secular phases can last years to decades. A short bounce inside a primary decline is therefore not the same regime as a multi-year advance. A secular trend can persist for years to decades and is often confirmed only after it ends. A cyclical trend is a shorter secondary phase, typically weeks to months, that can run against the primary trend.
A weekly Dow industrials ETF chart is used to mark a roughly 10-year advance ending in a March 2020 decline of 38% from the February 2020 peak before a bounce. A conventional bear-market label is defined as a drop of 20% or more from a prior high. Until new all-time highs appear, a powerful rebound is still treated as cyclical rather than secular.
A yield-curve inversion in which 10-year rates sat below three-month rates for more than one quarter is described as having preceded every recession since 1962. Editorial use: that regularity belongs to the surrounding regime. It does not recast a short rebound as a new secular trend.
Why a large up day can still be a bear rally
A bear rally is a sharp, often short-lived advance inside a downtrend, frequently driven by short covering and easily mistaken for a new bull. Two of the twelve largest one-day advances since 1929 are dated March 2020. A one-day gain of 5% or more is presented as more consistent with a bear-market rally than with a typical bull advance.
In the 2007-2009 decline, former support on the Dow industrials ETF later capped bounces as resistance, showing how broken support can define the ceiling of a bear rally.
Volume-weighted average price as a bounce filter
Volume-weighted average price is a volume-conditioned average used as a short-horizon filter for whether bounces hold participation-weighted support or keep slicing through it. During that same 2007-2009 bear sequence, five-day VWAP support was repeatedly broken before March 2009, after which VWAP began to hold as support.
TradersWeek editorial reading: repeated VWAP failures can falsify a dip-buying hypothesis on the bounce itself. A later shift to VWAP holding is a change in that filter, not proof that a secular trend has started.
Leadership head and shoulders as a warning
A head-and-shoulders is a three-swing reversal structure in which a higher middle peak fails and a neckline break turns a leadership chart into a warning that the broader advance may be weakening.
A weekly head-and-shoulders on the housing-sector index in 2005-2006 is presented as an early warning that housing leadership and the broader equity market were weakening. A daily head-and-shoulders with an upward-sloping neckline on a leading large-cap name from November 2019 through February 2020 formed immediately before that name and the broader market declined.
Editorial reading: those leadership breaks are conditions that can disprove a still-intact advance. They do not, by themselves, say how far any later bounce will run.
Facebook daily closes through a head-and-shoulders top
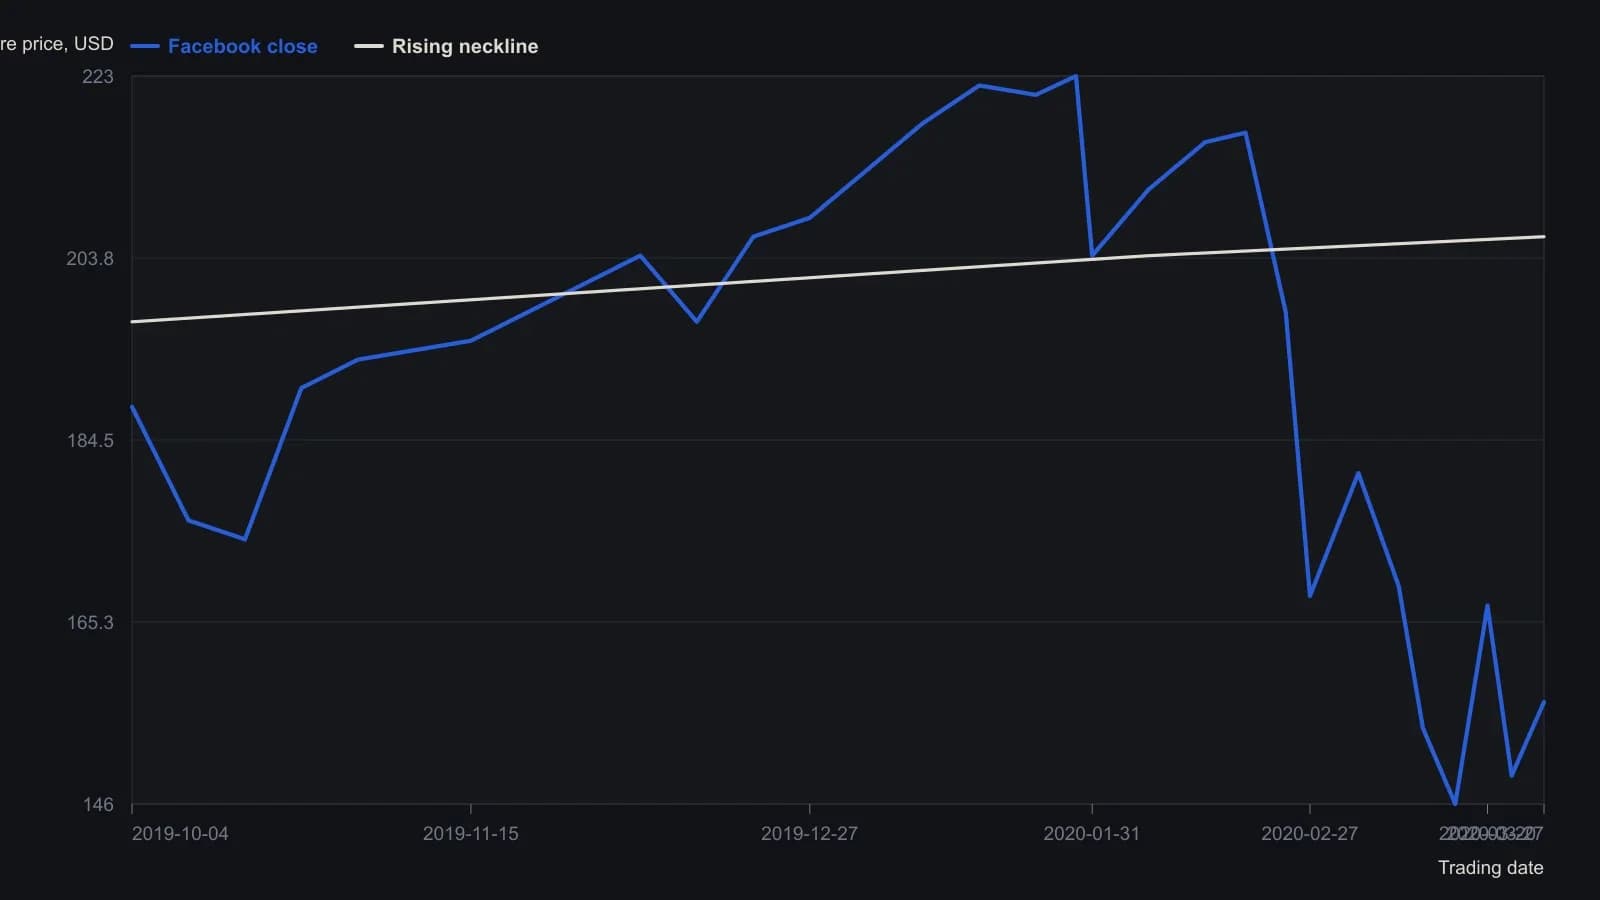
Interior prices are approximate to a few dollars because they were digitized from a daily candlestick pane with 10-dollar divisions. Neckline points follow the two troughs drawn on the figure, not a fitted model.
The three checks in order
TradersWeek editorial sequence: classify the regime, then ask whether leadership already failed a head-and-shoulders, then ask whether volume-weighted average price keeps breaking on the bounce. If the primary trend is still a decline, if former support is now resistance, and if participation-weighted support does not hold, the rebound remains a cyclical test inside a bear rally.
A rebound after a large drop is not automatically capitulation. Capitulation is an extreme combination of falling prices and rising volume in which selling pressure is treated as exhausted and a base-building process can begin. The archive workflow does not treat every bounce as that exhaustion.
All readings on this track · 18 readings
- 2000Volume-weighted average price as a baseline for indicator construction
- 2001Constructing VWAP support and resistance from cumulative volume
- 2001An elastic volume-weighted moving average from a share-count lookback
- 2001Constructing an elastic volume-weighted average and volatility bands
- 2004Volume-weighted column averages and crossovers on point-and-figure charts
- 2004Session volume-weighted average for limit placement and listed routing
- 2008Building MIDAS curves from an anchored volume-weighted average
- 2008Construct a launch-point VWAP as support and resistance filters
- 2014Workstation order routing, VWAP, and session filters
- 2015Constructing price gravity and float turnover filters
- 2015Constructing four-stage cycles with anchored VWAP
- 2017Constructing a volume-weighted crossover and breakout as one swing rule set
- 2017Constructing a volume-weighted moving-average crossover
- 2017Constructing anchored volume-weighted average price maps for crowd-visible execution costs
- 2018Order book heatmaps, VWAP, and flow for execution
- 2018Constructing futures rolls ahead of first notice day
- 2019Evaluate a mechanical futures system as one procedure
- 2020Every bounce is a falsifiable regime test