2017issue C0448-56
Constructing a volume-weighted moving-average crossover
April 2017 implementations treat a 50-bar volume-weighted average crossing a 70-bar simple moving average as a chart condition, typically on 15-minute bars. The same construction is then written as a next-bar market order, a five-bar scan-window, and a trailing-stop that bounds open risk after entry.
- April 2017 implementations used a 50-bar volume-weighted average crossing a 70-bar simple moving average, typically on 15-minute charts.
- The volume-weighted-average-price divides the sum of price times volume by the sum of volume, using trade volume on daily-or-higher bars and tick count on finer bars when those series differ.
- A companion strategy bought or sold the next bar at market on the moving-average-crossover, while packaged and reconstructed versions added a per-share stop, a profit-triggered trailing-stop, and reentry-confirmation.
- A scan-window looked for that upward cross within the last five bars on a 15-minute chart, and a short daily rescale of the same lengths produced many whipsaws.
What the 2017 code implements
The April 2017 code implementations treat the technique as a 50-bar volume-weighted average crossing a 70-bar simple moving average, typically on 15-minute charts. A companion strategy buys the next bar at market when the volume-weighted line crosses above the simple average and sells the next bar at market on the opposite cross.
How the volume-weighted line is assembled
The volume-weighted-average-price is a length-based average that divides the sum of price times volume by the sum of volume, so heavier-participation bars pull the line more than quiet bars. The volume-weighted calculation uses trade volume on daily-or-higher bars and tick count on finer bars when those series differ.
The false-breakout-filter is the claim that adding volume to the average can reduce breakouts that occur on thin participation.
How the crossover is coded and scanned
A moving-average-crossover is a long or short signal generated when the volume-weighted line crosses a simple moving average of a different length. An alternative buy formula fires on the same crossover or, after that event, on a new high above the highest high since the last crossover while the volume-weighted line remains above the simple average.
A scan implementation looks for the 50-bar volume-weighted average having crossed up through the 70-bar simple average within the last five bars on a 15-minute chart. That scan-window is a recent-bar lookback used to find symbols where the crossover has already occurred, rather than waiting for a live tick.
How a trailing-stop bounds the open risk
A trailing-stop is a profit-triggered dollar trail or support-based exit that bounds the open risk after entry rather than relying on the next opposite crossover. One packaged strategy places a per-share stop loss and, once open profit reaches a dollar threshold, switches to a per-share trailing stop.
One reconstruction adds optional stop-out modes plus reentry-confirmation. After a trailing or support stop, a new long requires a break above the prior trailing high while the volume-weighted line is still above the simple average.
What happens if the lengths are rescaled to daily bars
A daily-bar rescaling of the original 15-minute lengths was illustrated as roughly two versus three days, or a 1.4 factor between the two averages. Those short daily lengths produced many whipsaws on a wider window.
NASDAQ 100 daily VWMA/SMA crossover versus the S&P 500
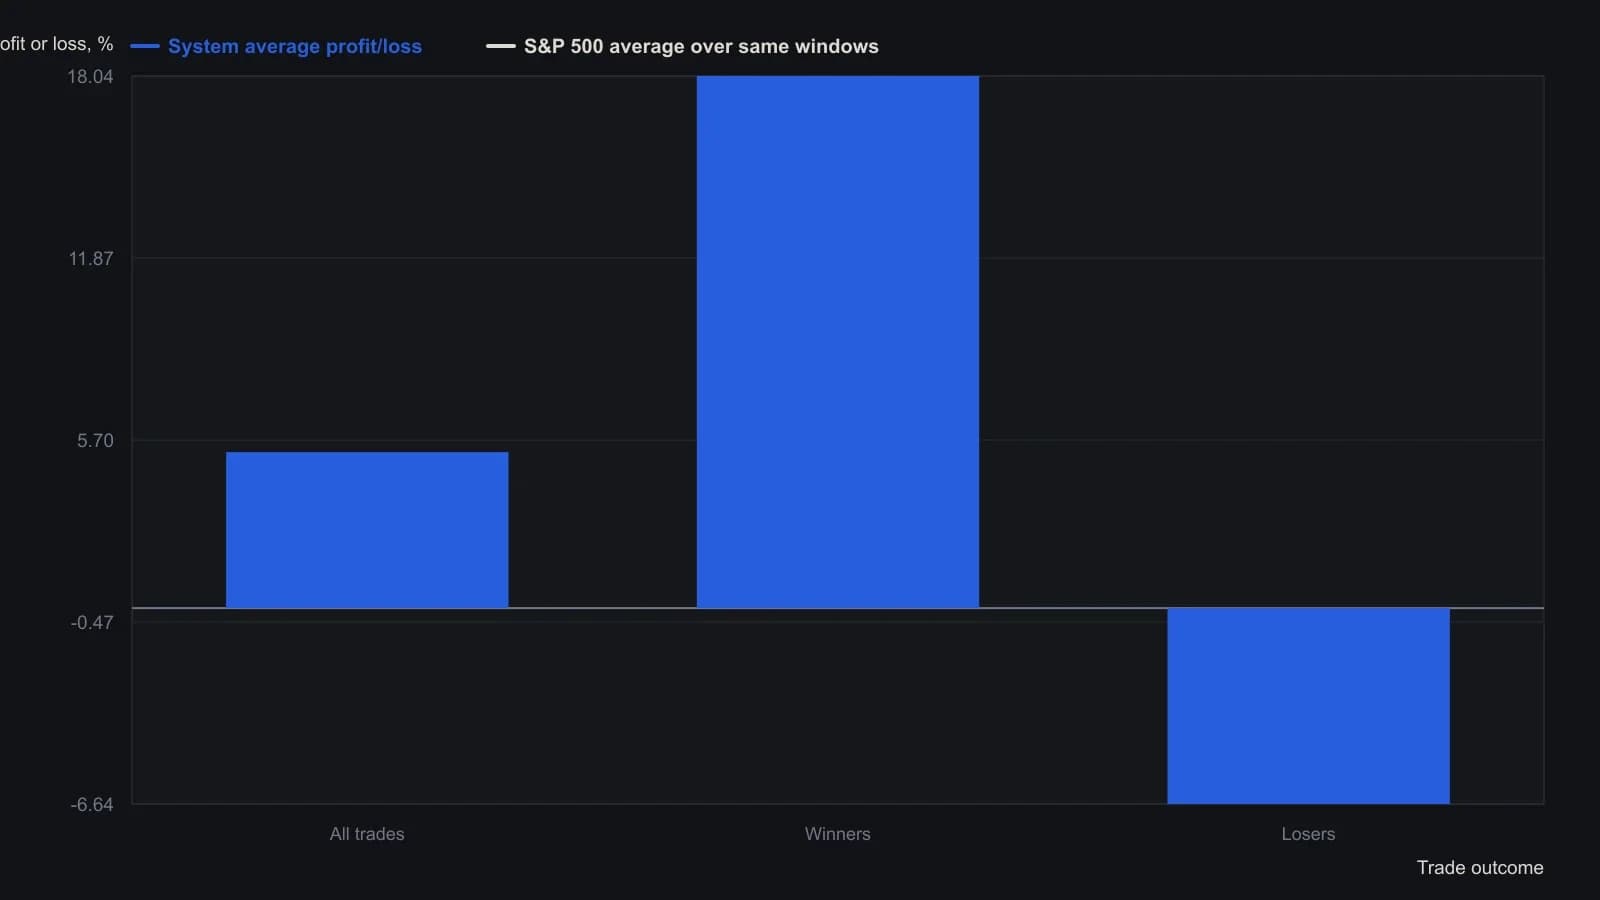
The test took at most three new names a day and ten open positions, 10 percent of equity each. Neutral trades were zero. Annualized IRR was 17.42 percent against an 18.57 percent peak-to-valley drawdown; S&P 500 buy-and-hold over the same span returned 19.66 percent a year.
All readings on this track · 18 readings
- 2000Volume-weighted average price as a baseline for indicator construction
- 2001Constructing VWAP support and resistance from cumulative volume
- 2001An elastic volume-weighted moving average from a share-count lookback
- 2001Constructing an elastic volume-weighted average and volatility bands
- 2004Volume-weighted column averages and crossovers on point-and-figure charts
- 2004Session volume-weighted average for limit placement and listed routing
- 2008Building MIDAS curves from an anchored volume-weighted average
- 2008Construct a launch-point VWAP as support and resistance filters
- 2014Workstation order routing, VWAP, and session filters
- 2015Constructing price gravity and float turnover filters
- 2015Constructing four-stage cycles with anchored VWAP
- 2017Constructing a volume-weighted crossover and breakout as one swing rule set
- 2017Constructing a volume-weighted moving-average crossover
- 2017Constructing anchored volume-weighted average price maps for crowd-visible execution costs
- 2018Order book heatmaps, VWAP, and flow for execution
- 2018Constructing futures rolls ahead of first notice day
- 2019Evaluate a mechanical futures system as one procedure
- 2020Every bounce is a falsifiable regime test