2008issue C091-6
Construct a launch-point VWAP as support and resistance filters
A session volume-weighted average price is an institutional execution benchmark. MIDAS starts that average only after a clear trend reversal so later price and volume can map a short hierarchy of support and resistance filters.
- A standard session volume-weighted average price is total traded value divided by total traded volume and is used to keep institutional fills aligned with market volume.
- MIDAS starts the same average only at a clear trend reversal so later cumulative price and volume, not pre-reversal data, define nonlinear support and resistance curves.
- On-balance volume can confirm a probable launch when a multi-hour upward trend persists while price retests an earlier low.
- Successive curves from one swing low are kept to a working limit of about four to five active filters, and intraday curves can show porosity, role reversal, and coalescence.
Start the average after the reversal
A standard session volume-weighted average price is total traded value divided by total traded volume. It is used as an institutional execution benchmark to keep fills aligned with market volume and reduce market-impact cost.
MIDAS is a volume-weighted average price construction started only at a clear trend reversal. Later cumulative price and volume, not pre-reversal data, then define nonlinear support and resistance curves.
The same MIDAS algorithm is applied symmetrically to projected tops and bottoms. It remains valid from daily position-trading charts down to intraday daytrading charts.
Measure displacement from the launch point
The launch point is the first bar after a trend reversal from which the MIDAS displacement is measured. The formula is a volume-displacement volume-weighted average price: cumulative price times current cumulative volume, minus cumulative price times the volume d units earlier, all divided by d, where d is the cumulative-volume gap from the launch point.
Launching before the reversal mixes older accumulation or distribution psychology into the curve and contaminates the new support and resistance hierarchy.
Confirm a probable launch
On-balance volume can confirm a probable MIDAS launch. A multi-hour upward on-balance volume trend while price retests an earlier low is treated as a positive divergence that puts existing resistance curves under pressure.
Stack a short hierarchy of curves
Once a probable bottom is in place, successive MIDAS support curves are plotted from that swing low. The illustrated sequence ended after a fourth curve, consistent with a working limit of about four to five active curves.
Intraday MIDAS, the same construction applied on an intraday chart, can show porosity, later role reversal from support to resistance, and coalescence of a newer resistance curve with older support curves. Porosity is a temporary price penetration of a MIDAS curve that later reasserts as support or resistance.
Launch-point MIDAS filters on daily crude oil
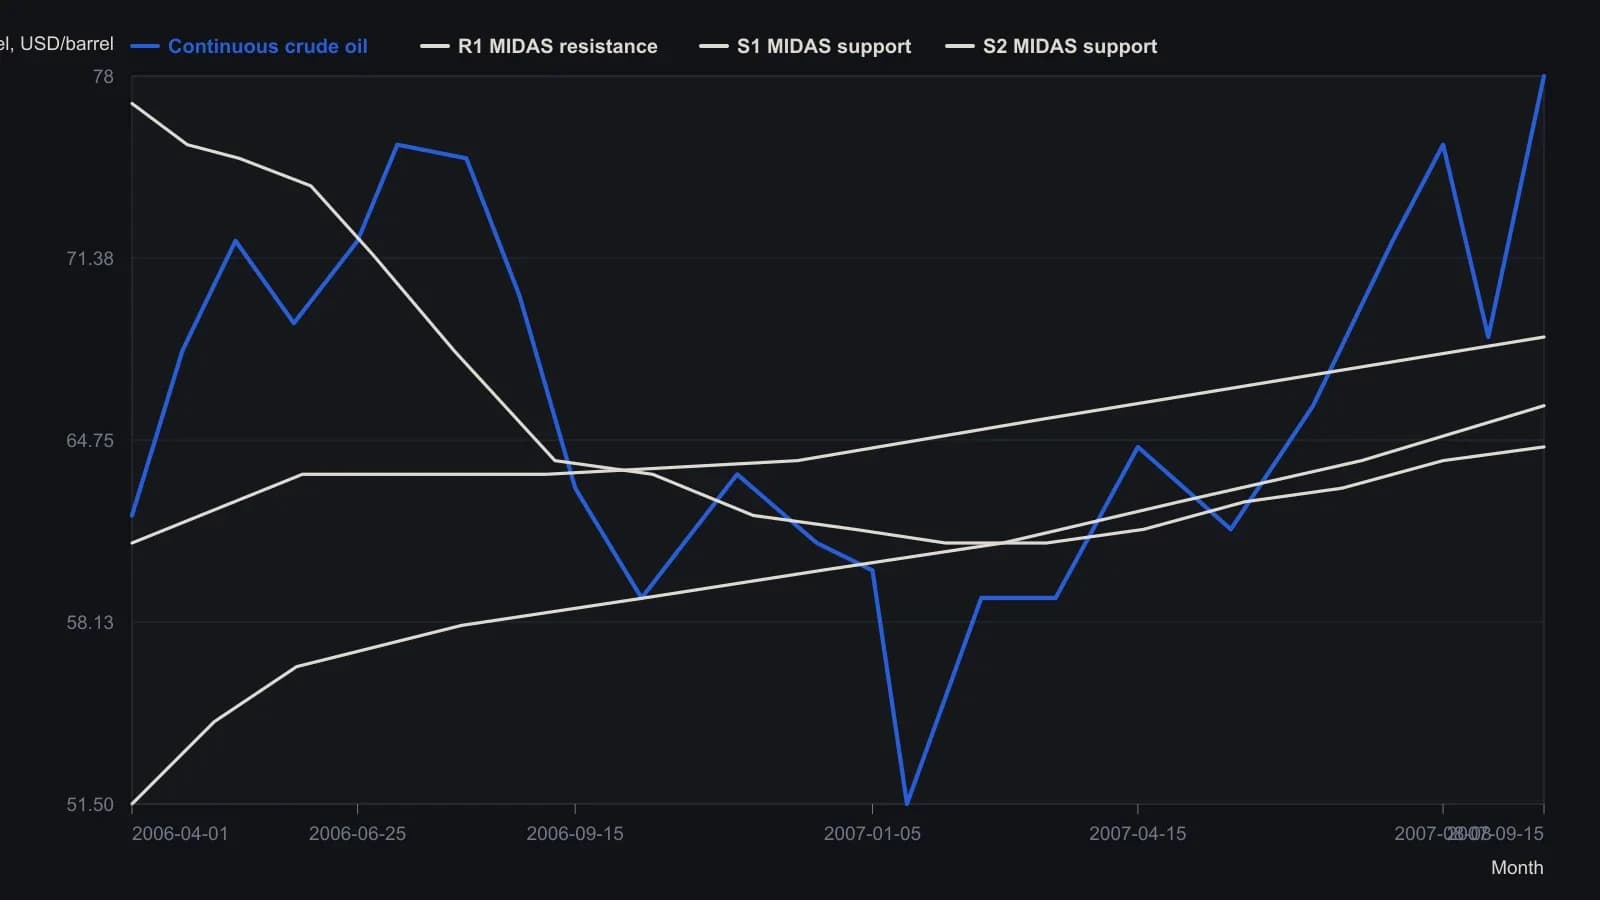
Each average is started only at a clear swing reversal so earlier volume is left out. The source treats four to five stacked curves as a typical exhaustion count. Values are approximate to about half a dollar.
All readings on this track · 18 readings
- 2000Volume-weighted average price as a baseline for indicator construction
- 2001Constructing VWAP support and resistance from cumulative volume
- 2001An elastic volume-weighted moving average from a share-count lookback
- 2001Constructing an elastic volume-weighted average and volatility bands
- 2004Volume-weighted column averages and crossovers on point-and-figure charts
- 2004Session volume-weighted average for limit placement and listed routing
- 2008Building MIDAS curves from an anchored volume-weighted average
- 2008Construct a launch-point VWAP as support and resistance filters
- 2014Workstation order routing, VWAP, and session filters
- 2015Constructing price gravity and float turnover filters
- 2015Constructing four-stage cycles with anchored VWAP
- 2017Constructing a volume-weighted crossover and breakout as one swing rule set
- 2017Constructing a volume-weighted moving-average crossover
- 2017Constructing anchored volume-weighted average price maps for crowd-visible execution costs
- 2018Order book heatmaps, VWAP, and flow for execution
- 2018Constructing futures rolls ahead of first notice day
- 2019Evaluate a mechanical futures system as one procedure
- 2020Every bounce is a falsifiable regime test