2008issue C091-13
Building MIDAS curves from an anchored volume-weighted average
A same-day volume-weighted average is a session pricing benchmark. A MIDAS curve starts the same ratio at a chosen bar and continues it forward so it can be tested as support or resistance.
- A standard same-day volume-weighted average is the day's traded value divided by that day's traded volume and is used as a transaction-pricing and execution-efficiency benchmark.
- A MIDAS curve reuses that principle from a chosen date and time and continues it forward as a support or resistance overlay.
- The plotted value accumulates typical price times volume from the anchor bar and divides by volume since that bar, using a one-unit substitute if the volume total would be zero.
- A curve launched from a key high is meant to be tested as resistance, and a curve launched from a key low is meant to be tested as support.
From a session benchmark to a chart overlay
A standard same-day volume-weighted average is the day's traded value divided by that day's traded volume. It is used as a transaction-pricing and execution-efficiency benchmark.
The MIDAS construction reuses the volume-weighted-average principle as a chart overlay. The curve can be started at a chosen date and time and then continued forward as a support or resistance line.
How the curve is assembled
The plotted value begins at an anchor bar. That bar's date, time, and price-volume state reset the cumulative sums that define the MIDAS curve.
From the start bar, typical price is multiplied by that bar's volume. Typical price is the midpoint or median of the bar. Those products are accumulated as cumulative price-volume and then divided by the volume accumulated since the same start bar.
If the volume denominator would otherwise be zero, a one-unit substitute is used.
When the sums begin
The start is a user input of month, day, year, and session time. The cumulative sums begin only after that date and time is reached.
How the overlay was drawn
On an hourly SPY chart, the same indicator is applied six times, with start dates 10/11/2007, 10/31/2007, 12/11/2007, 1/23/2008, 3/17/2008, and 4/15/2008.
On an S&P e-mini daily chart, cumulative volume-weighted-average lines started at extreme highs or lows are presented as candidate resistance and support. They can be shown with one-standard-deviation bands above and below the average.
The intended chart test
The intended chart hypothesis is that a curve launched from an extreme high is tested as resistance and a curve launched from an extreme low is tested as support.
A key high or low is a visually extreme swing used as the intended starting point. Support and resistance here means a chart condition in which price is hypothesized to stall or reverse near a constructed MIDAS curve started at a prior swing extreme.
Editorial reading: that repeatable chart condition is a hypothesis to test on the chart, not a claim that the curve will hold.
Anchored MIDAS on daily light crude oil
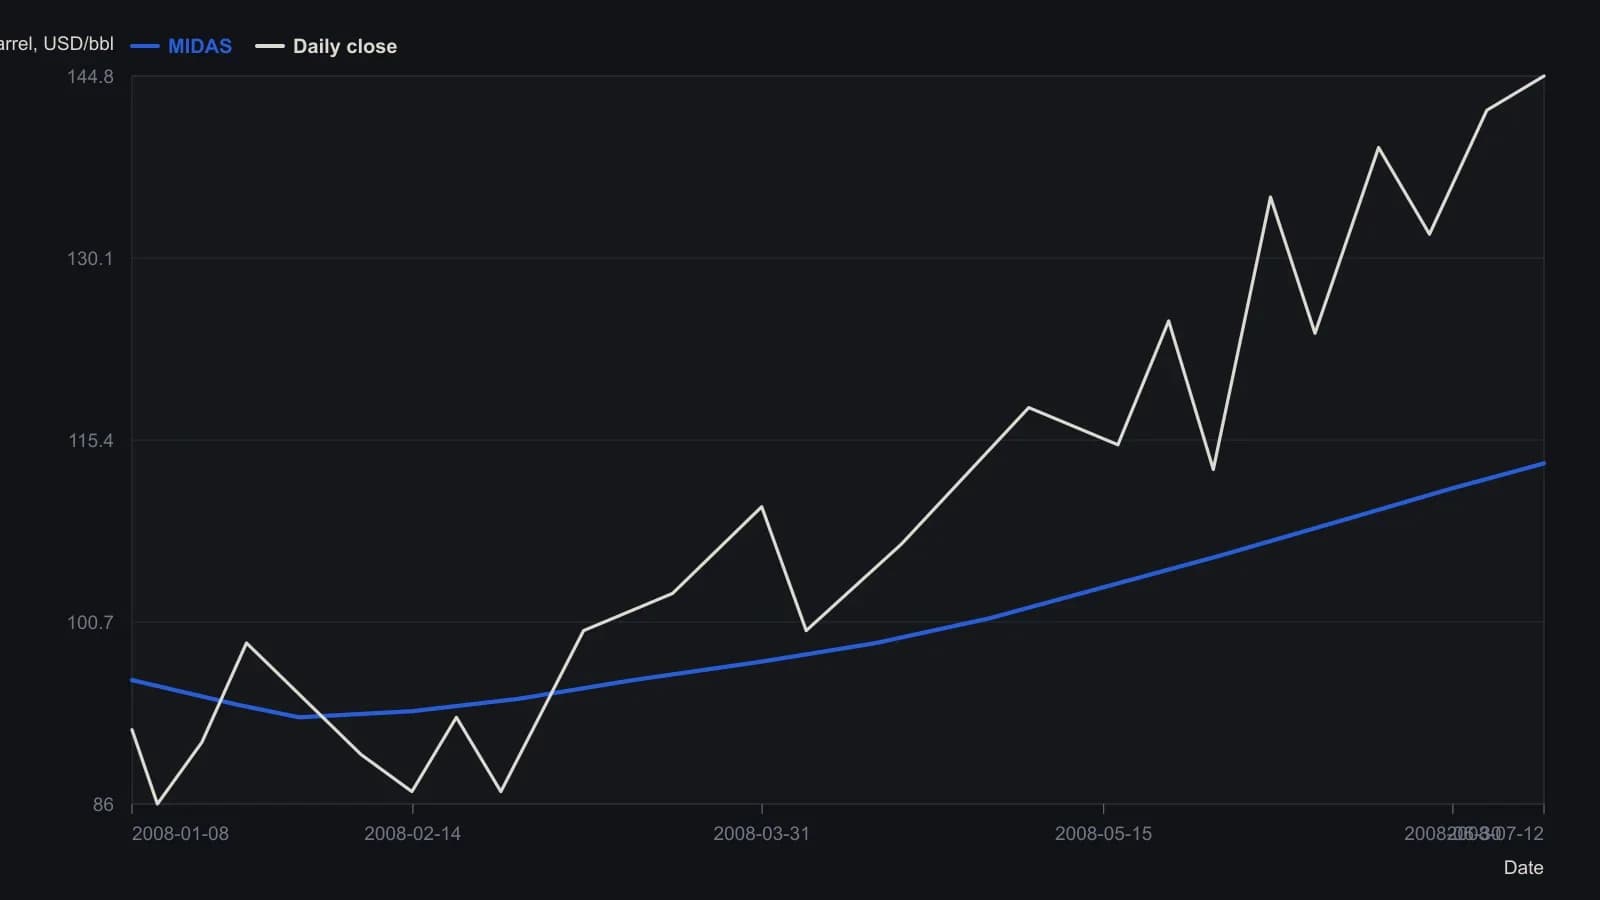
The published eSignal script defaults the start date to 1/2/2008 with time 00:00 on daily bars. Digitized coordinates are only good to about one dollar; 144.77 and 113.50 are the chart’s own 12 July 2008 readouts.
All readings on this track · 18 readings
- 2000Volume-weighted average price as a baseline for indicator construction
- 2001Constructing VWAP support and resistance from cumulative volume
- 2001An elastic volume-weighted moving average from a share-count lookback
- 2001Constructing an elastic volume-weighted average and volatility bands
- 2004Volume-weighted column averages and crossovers on point-and-figure charts
- 2004Session volume-weighted average for limit placement and listed routing
- 2008Building MIDAS curves from an anchored volume-weighted average
- 2008Construct a launch-point VWAP as support and resistance filters
- 2014Workstation order routing, VWAP, and session filters
- 2015Constructing price gravity and float turnover filters
- 2015Constructing four-stage cycles with anchored VWAP
- 2017Constructing a volume-weighted crossover and breakout as one swing rule set
- 2017Constructing a volume-weighted moving-average crossover
- 2017Constructing anchored volume-weighted average price maps for crowd-visible execution costs
- 2018Order book heatmaps, VWAP, and flow for execution
- 2018Constructing futures rolls ahead of first notice day
- 2019Evaluate a mechanical futures system as one procedure
- 2020Every bounce is a falsifiable regime test