2015issue C1024-27
Constructing four-stage cycles with anchored VWAP
A quarterly-length average is used first to place a market in accumulation, advance, distribution, or decline. Support and resistance are then built from volume-weighted average price anchored at highs, lows, and gaps, so the chart can be read against a crowd cost line that fades as newer anchors appear.
- Market cycles are constructed as four stages: accumulation and distribution as the nontrending bases, and advance and decline as the trending phases.
- If the stage is not clear at a glance, move to a higher time frame. If liquidity still cannot support a reading, set the chart aside.
- A 13-week simple or exponential moving average is the overlay used to help mark those stages, because that length matches a typical quarterly release cycle for fundamental data.
- Support and resistance can be hung from volume-weighted average price anchored at highs, lows, and gaps, with older anchors losing influence as newer ones replace them.
Four stages, not one trend
Market cycles are constructed as four phases. Two are trending and are labeled advance and decline. Two are nontrending and are labeled accumulation and distribution. The four-stage cycle splits price history this way rather than treating the chart as a single unbroken trend.
Accumulation is defined as following a decline, typically with lower volatility and a transfer of shares from many holders to fewer. Distribution is defined as following an advance, typically with higher volatility and the reverse transfer.
Feedback, bases, and price gravity
Positive feedback is described as the force that extends a trend after a temporary bid-ask imbalance. Negative feedback is described as the force that produces oscillations and retracements, including pullbacks inside a larger trend.
In a sustained advance, price is described as pausing in horizontal consolidating bases before a possible move to a higher base. A breakout from such a base is said to require new money in addition to shares changing hands. That contrast is price gravity: a further rise needs additional inbound money, while a fall can accelerate once selling replaces holding.
Marking the stage with a quarterly average
A 13-week simple or exponential moving average is used as a construction overlay to help mark cycle stages. That length is chosen because it matches a typical quarterly release cycle for fundamental data.
Support and resistance from anchored VWAP
Support and resistance can be constructed from volume-weighted average price anchored at structural events such as highs, lows, and gaps. The start of the interval is held fixed while the calculation window is extended.
The influence of an anchored volume-weighted average price level is described as declining over time as newer anchors replace older ones.
AAPL daily price with three anchored VWAPs
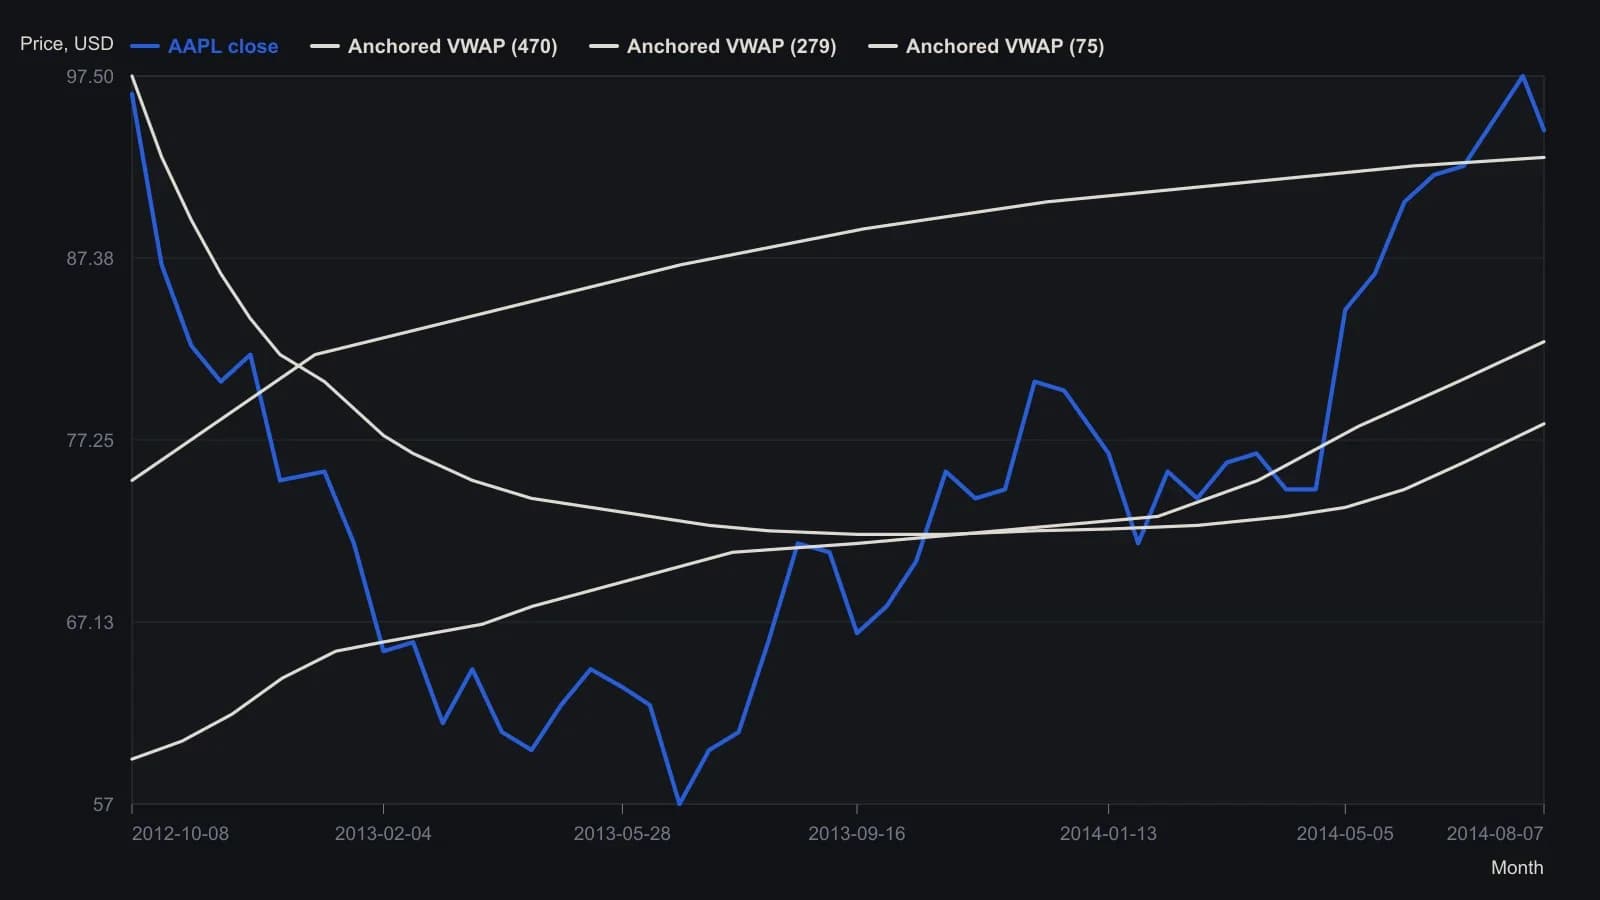
Anchored VWAP values at the last bar (7 Aug 2014 close 94.48) are taken from the chart legend: 75-bar VWAP 92.97, 279-bar VWAP 82.72, 470-bar VWAP 78.15. Intermediate points are approximate readings of the plotted curves.
When headlines and price disagree
A news-price divergence is commentary that implies new highs or lows while price fails to exceed the prior extreme. It is presented as a sign that the money flux supporting the prior direction has dried up.
All readings on this track · 18 readings
- 2000Volume-weighted average price as a baseline for indicator construction
- 2001Constructing VWAP support and resistance from cumulative volume
- 2001An elastic volume-weighted moving average from a share-count lookback
- 2001Constructing an elastic volume-weighted average and volatility bands
- 2004Volume-weighted column averages and crossovers on point-and-figure charts
- 2004Session volume-weighted average for limit placement and listed routing
- 2008Building MIDAS curves from an anchored volume-weighted average
- 2008Construct a launch-point VWAP as support and resistance filters
- 2014Workstation order routing, VWAP, and session filters
- 2015Constructing price gravity and float turnover filters
- 2015Constructing four-stage cycles with anchored VWAP
- 2017Constructing a volume-weighted crossover and breakout as one swing rule set
- 2017Constructing a volume-weighted moving-average crossover
- 2017Constructing anchored volume-weighted average price maps for crowd-visible execution costs
- 2018Order book heatmaps, VWAP, and flow for execution
- 2018Constructing futures rolls ahead of first notice day
- 2019Evaluate a mechanical futures system as one procedure
- 2020Every bounce is a falsifiable regime test