1991issue C091-12
GM support and resistance role reversal
Monthly GM history clustered around the 30 area, and the 40-42 band later flipped from 1983-1985 resistance into support after price traded through 40. Former highs around 30 became later support, including the January 1991 halt a few eighths above 30.
- Support is a demand zone that can halt a decline or start an advance, and resistance is a supply zone that can halt a rise or start a decline.
- A former high becomes support after price trades above it, and a former low becomes resistance after price trades below it.
- Treat Support and resistance as levels approached on a chart, not as a single exact price. Heavier volume makes a level more significant.
- A preferred sequence is to wait for Breakout confirmation after an intermediate correction, then buy only on a Throwback and pullback toward newly created support rather than while price is far above that support.
Support and resistance as zones
Support is a demand zone that can halt a decline or start an advance, and resistance is a supply zone that can halt a rise or start a decline.
Support and resistance should be treated as price levels approached on a chart, not as a single exact price. Heavier volume at a level makes that level more significant.
When former highs become support
A former high becomes support after price trades above it, and a former low becomes resistance after price trades below it.
Monthly GM history since 1983 clustered around the 30 area, including lows at 28, 30, 32, 33, 25, 30 and 33. The 1987 print to 25 still left most volume near 30.
After GM cleared the 1978-1982 highs of 33, 32, 29, 29 and 32, those former highs around 30 became later support, including the January 1991 halt a few eighths above 30.
The 40-42 band
The 40-42 band first acted as 1983-1985 resistance, then as support in 1989 after the 1987 advance through 40 to 47. Resistance and support can exchange roles.
Breakout confirmation and the 1987 tests of 40
In 1987, GM accelerated after clearing February-March congestion near 40, then found intermediate support at 40 on the July test after the May high of 46-1/8. Failure of that 40 support in October marked a major trend reversal.
After the 1987 decline, the former 40 support acted as resistance on the recovery. Little resistance was expected between 30 and 40 because most panic volume traded near 30 rather than in that gap.
Throwback and pullback after the break
A preferred sequence is to wait for Breakout confirmation after an intermediate correction, then buy only on a Throwback and pullback toward the newly created support rather than while price is far above that support.
After GM spent months locked between 30 support and 40 resistance, a decisive high-volume break above 40 returned 40 to support status and framed later buying as pullbacks to that level. Some high-momentum names never form that two-steps-forward, one-step-back pattern.
GM, May 1989–January 1990: triangle sitting on flipped 40 support
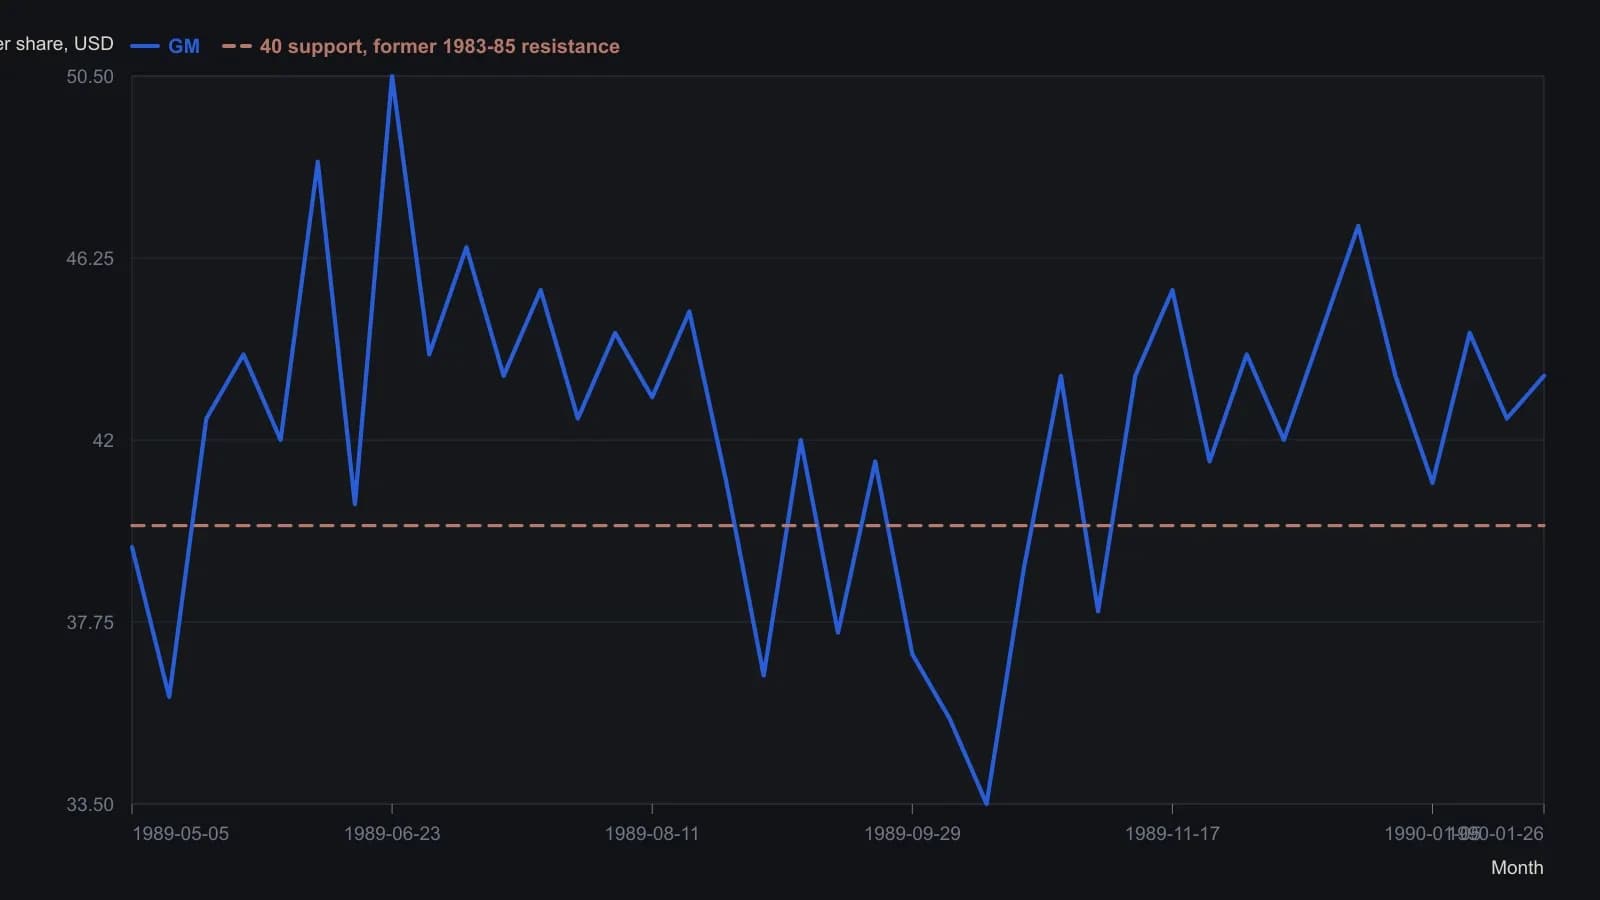
OHLC bars reduced to one typical price per week and rounded to the nearest half-dollar, as fine as the raster will support. Wicks that only tag a level are not treated as closes.
All readings on this track · 10 readings
- 1991GM support and resistance role reversal
- 2002Evaluating throwbacks and pullbacks after triangle breakouts
- 2002Spike-shaped double bottoms as a three-gate chart drill
- 2003Constructing bullish bottom patterns from structure and confirmation
- 2003Classifying breakout gaps by fill speed and throwback
- 2006The J-hook as two gates: rounded pullback and prior-high breakout
- 2006Evaluating double tops with a throwback clock
- 2007Check duration, breakout labels, and throwback timing before rectangle measuring rules
- 2016Confirmed double-bottom, later pennant, and throwback as separate checkpoints
- 2020Late double-bottom entries after throwbacks