1990issue C081
A chi-square test of split frequency histograms across price aggregations
Alternate observations of an ordered price series can be placed into two frequency histograms and compared through percentile differences. A chi-square test of those differences was not significant for the daily prices under study, but the same procedure on pairwise and triplewise sums was interpreted as evidence of non-randomness.
- Consecutive observations of an ordered price series can be assigned to opposite frequency histograms, with each cell count converted to a relative frequency.
- Nine decile prices from the first histogram are located on the second histogram, and the resulting percentile differences are tested with a chi-square statistic.
- For the daily prices under study, a chi-square value of 10.9797 was not significant, so those observations were judged consistent with randomness.
- The same procedure on pairwise and triplewise sums produced chi-square values of 16.7153 and 92.646, interpreted as evidence of non-randomness.
Alternate observations fill two histograms
An ordered price series can be assigned alternately into two frequency histograms so consecutive observations land in opposite histograms. A frequency histogram is a binning of ordered prices, or of summed aggregations of those prices, into cells whose counts are converted to relative frequencies.
Each histogram cell count is converted to a relative frequency by dividing by the total number of prices in that histogram.
Decile prices become percentile differences
Nine decile prices taken from the first histogram are then located on the second histogram to read the matching percentiles. A percentile difference is the gap between the percentile rank of a given price in the first histogram and the percentile rank of that same price in the second histogram.
Subtracting the second-histogram percentiles from the first-histogram percentiles produces percentile differences that are then tested with a chi-square statistic. In this workflow, the chi-square test is a significance check applied to those percentile differences to judge whether the gaps are consistent with chance.
Daily prices looked consistent with randomness
For the daily prices under study, a chi-square value of 10.9797 was not significant, so those daily observations were judged consistent with randomness.
The same test on higher aggregations
The same two-histogram procedure can be repeated after summing adjacent prices and treating those sums as a higher aggregation of the original series. A higher aggregation is a derived series formed by summing adjacent original prices before they are placed into the two histograms.
Pairwise aggregated prices produced a chi-square value of 16.7153, which was interpreted as evidence of non-randomness. Triplewise aggregated prices produced a chi-square value of 92.646, described as strong evidence of non-randomness.
Editorial reading of the two-scale check
Editorial interpretation: TradersWeek treats the daily result and the aggregated results as one evaluation sequence. First come the split frequency histograms and the chi-square comparison on the original daily series. Then the exact test is rerun after neighbors are summed.
Editorial interpretation: the daily chi-square value left the split histograms looking consistent with randomness, while the pairwise and triplewise higher aggregations did not. TradersWeek reads that contrast as a teaching check on scale, not as a reason to stop after the daily baseline.
Split-histogram chi-square on S&P 500 prices at three aggregations
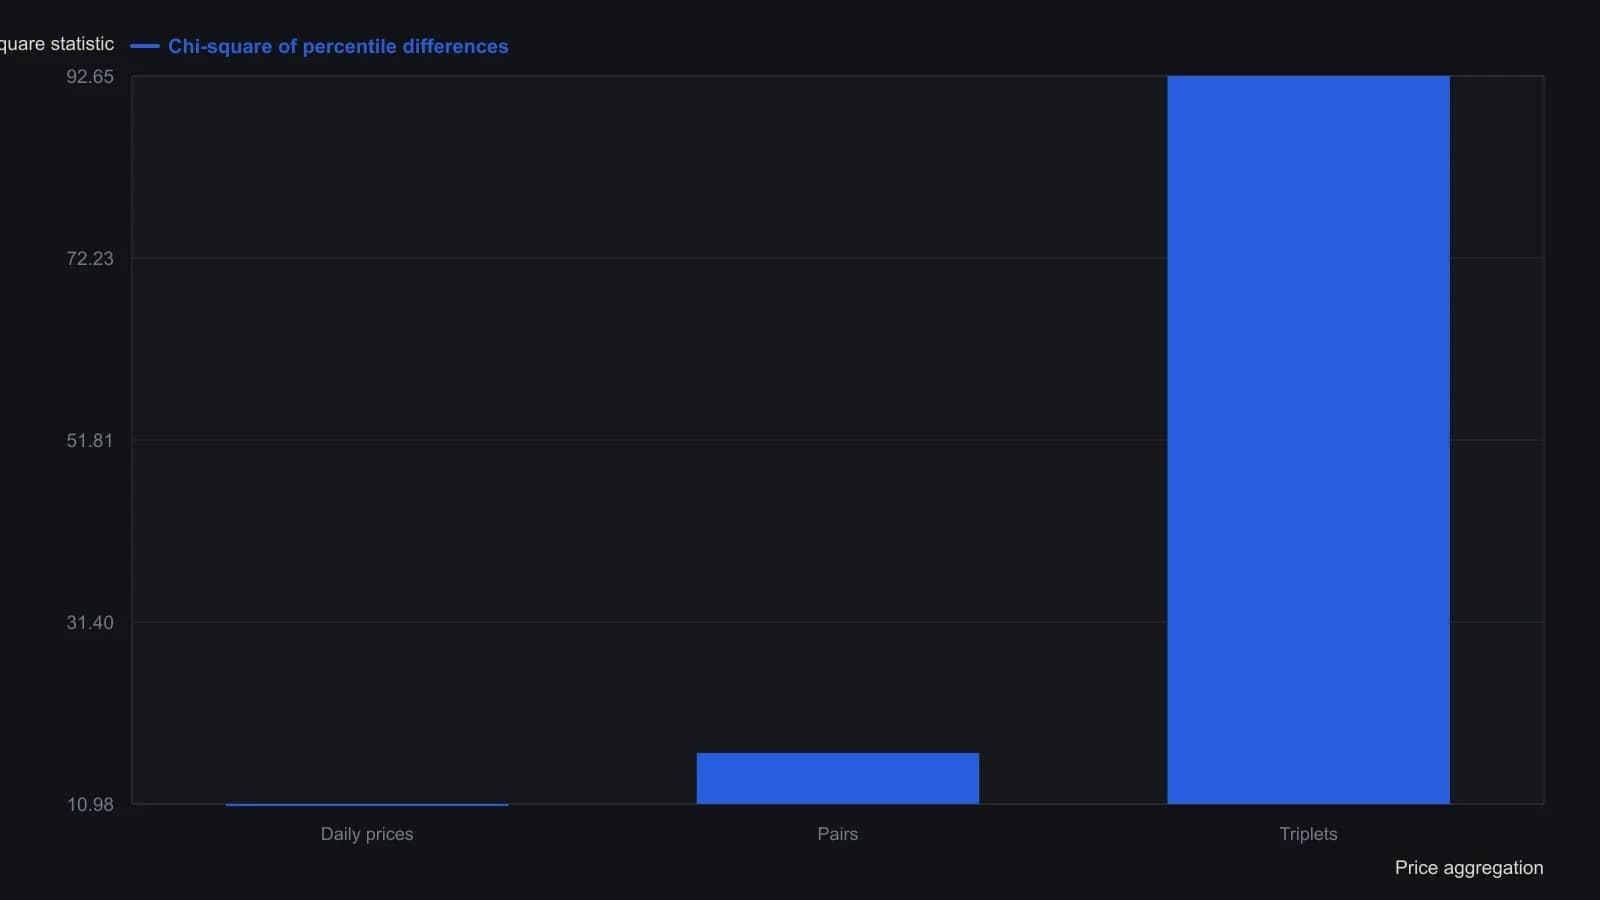
Each test fills two histograms with alternate observations, scores the first histogram’s nine decile prices as percentiles in the second, and chi-squares those percentile differences. The sidebar does not give degrees of freedom or a critical value.
All readings on this track · 17 readings
- 1987Testing price-volume agreement after percent reversal filters
- 1988Constructing chi-square tests for two-way price counts
- 1988Building consensus indicators with correlation and the chi-square test
- 1988Test edges against chance, not story
- 1988Constructing an advance-decline divergence oscillator
- 1989Evaluate a contrary put-call premium ratio at a stated horizon
- 1990A weekly resistance-index from hourly volume-per-point
- 1990Testing breadth above moving averages by horizon
- 1990Evaluating member versus odd-lot breadth
- 1990A chi-square test of split frequency histograms across price aggregations
- 1990Evaluating smoothed secondary counts with a chi-square test
- 1991Treat session high and low times as codes, then require a chi-square check
- 1991A signed hourly swing catalog as a next-session chi-square check
- 1992Constructing a chi-square test as a gate for two-way market records
- 1992Percent filters, log point-and-figure, and breadth residuals
- 1997Build a chi-square stationarity screen before you forecast
- 1998Timed breakout rules after a nested-bar contraction