1991issue C031-3
Treat session high and low times as codes, then require a chi-square check
A two-digit high-low code records when a session high and low printed. Each code was scored by next-session direction, then a chi-square pattern screen marked which pairings met a stated significance threshold.
- Turn session high and low times into a two-digit high-low code with an hour-digit map, so the day is a discrete pattern type rather than a pair of clock stamps.
- Score each stored code by next-session direction in a widely followed industrial average, not by the clock labels themselves.
- Use a chi-square pattern screen against an explicit baseline before calling any timing code informative.
- In the 19-year hourly review, only codes 17 and 71 were treated as distinguishable after that screen.
Encode the session as a two-digit high-low code
A session can be labeled with a two-digit high-low code. The first digit marks the time of the daily high. The second digit marks the time of the daily low.
An hour-digit map replaces each trading hour with a single digit so high-low timing can be stored as countable pattern types rather than as raw clock stamps. Under that encoding, a high near 11 a.m. paired with a low near 3 p.m. is stored as type 26.
Score the code by next-session direction
The comparison used an hourly archive that began in 1971 and spanned 19 years. Each stored high-low code was scored against the following day's move in a widely followed industrial average.
Next-session direction is whether that average finished higher or lower after a given high-low timing code. Chi-square tests were applied to every pattern type to mark which next-session associations met a stated significance threshold.
The chi-square pattern screen is a contingency test. It asks whether up versus down counts for a coded high-low state differ from an explicit baseline over a stated hourly lookback.
Next-day DJIA direction after each high-low timing code
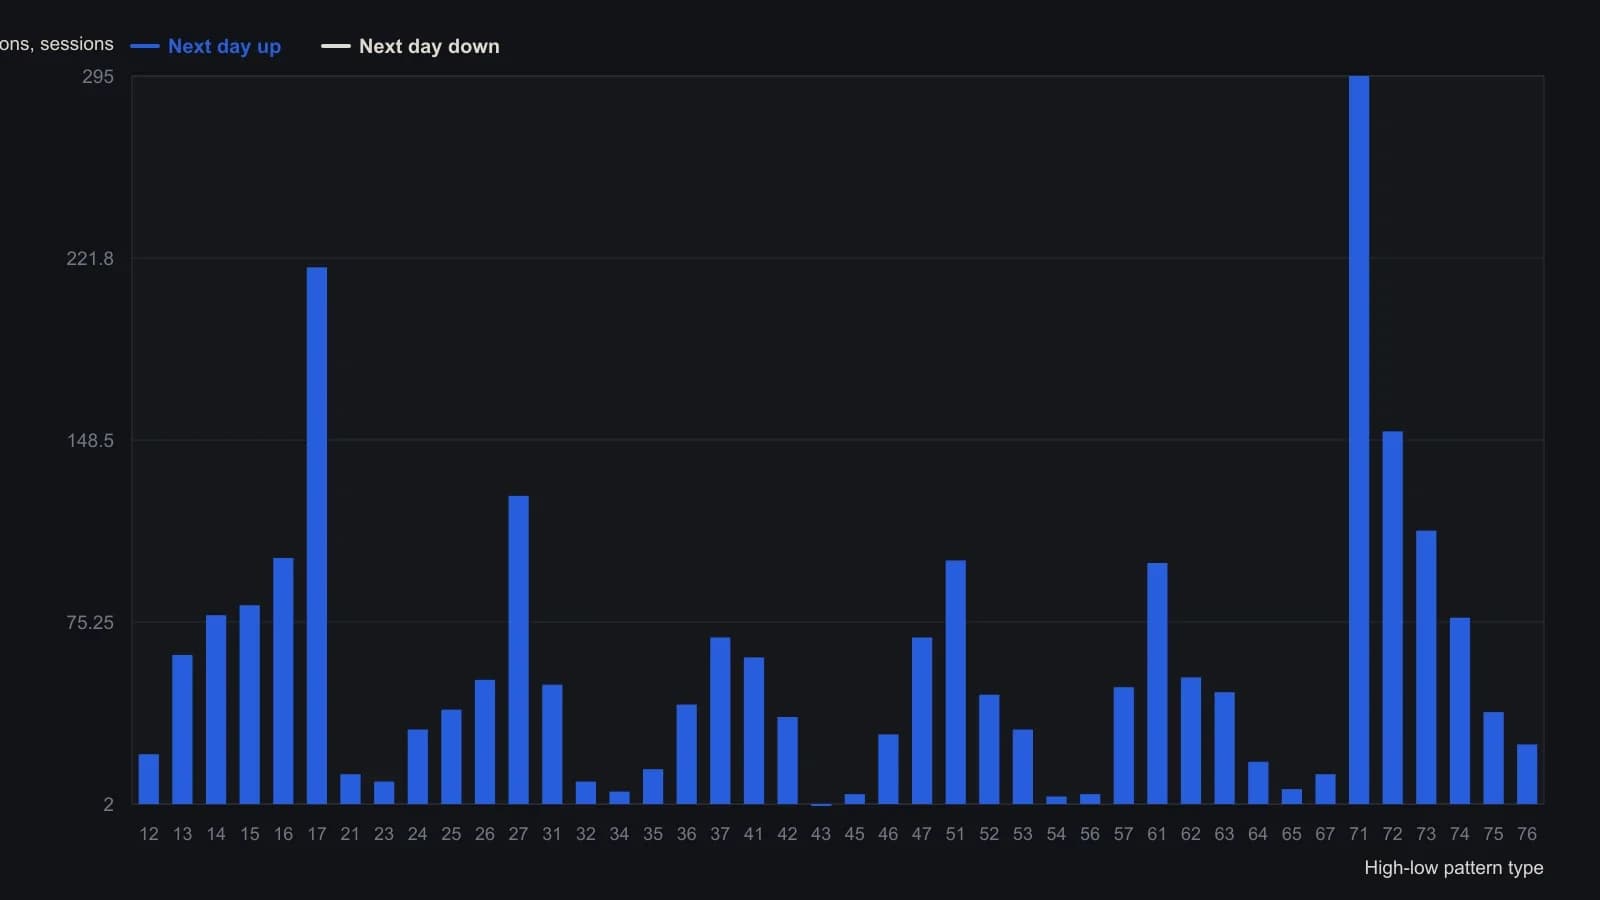
Hours are coded as single digits (1 at the open through 7 at the close). Same-hour codes such as 22 or 55 are absent because a session cannot print its high and low in the same hour. On the source table, N means the cell was too small for a chi-square call, not that a test was run and failed.
Read the screen, not the code alone
In that 19-year hourly review, only codes 17 and 71 were singled out as the two pattern types whose next-session directional counts were treated as distinguishable after the chi-square screen.
A results table summarized, for each high-low hour pairing, whether the following session's direction showed an association in that hourly sample.
Editorial reading: the archive workflow stores timing first and tests association second. Passing the screen is what made a code count as distinguishable in that sample.
All readings on this track · 17 readings
- 1987Testing price-volume agreement after percent reversal filters
- 1988Constructing chi-square tests for two-way price counts
- 1988Building consensus indicators with correlation and the chi-square test
- 1988Test edges against chance, not story
- 1988Constructing an advance-decline divergence oscillator
- 1989Evaluate a contrary put-call premium ratio at a stated horizon
- 1990A weekly resistance-index from hourly volume-per-point
- 1990Testing breadth above moving averages by horizon
- 1990Evaluating member versus odd-lot breadth
- 1990A chi-square test of split frequency histograms across price aggregations
- 1990Evaluating smoothed secondary counts with a chi-square test
- 1991Treat session high and low times as codes, then require a chi-square check
- 1991A signed hourly swing catalog as a next-session chi-square check
- 1992Constructing a chi-square test as a gate for two-way market records
- 1992Percent filters, log point-and-figure, and breadth residuals
- 1997Build a chi-square stationarity screen before you forecast
- 1998Timed breakout rules after a nested-bar contraction