1990issue C051-2
Testing breadth above moving averages by horizon
Weekly market breadth can be the share of listed issues above a 10-week or 30-week moving average. High and low readings become directional forecasts only after the lookback, the forecast horizon, and a continuation or contrary-mapping are locked, then scored with a chi-square test.
- Weekly market breadth can be measured as the share of listed issues above a 10-week moving average and, separately, above a 30-week moving average.
- Noticeably high and low readings were labeled with standard-deviation bands around a 10-year mean, then scored as directional forecasts at each declared forecast horizon.
- A chi-square test did not mark short-horizon checks on the 10-week series as statistically notable, while the 30-week series used contrary-mapping for next-year direction.
- The evaluation selected the 30-week share-above-average series as the primary long-horizon watch, mapping high readings as cautionary and low readings as constructive.
A weekly participation count
Weekly market breadth can be measured as the percentage of listed issues trading above a 10-week moving average and, separately, above a 30-week moving average. Market breadth here is the share of listed issues participating above a chosen moving average, used as a market-wide participation signal rather than a single-name pattern.
A moving average, in this workflow, is a fixed-lookback average of weekly prices that classifies each issue as above or below. That classification produces separate 10-week and 30-week breadth counts.
Lock the label, the window, and the mapping
Noticeably high and low readings were marked with two-thirds-standard-deviation and one-standard-deviation bands around a 10-year mean, then scored as directional forecasts over the next week, five weeks, 13 weeks, 26 weeks, and one year.
A standard-deviation band is a historical-mean envelope, at two-thirds and one standard deviation, used to label a breadth reading as noticeably high or low. A forecast horizon is the forward window against which a labeled extreme is scored.
The 10-week series
Short-horizon checks on the 10-week series were not reported as statistically notable. A chi-square test indicated significance only for the 26-week window when a reading above one standard deviation was treated as bullish and a reading below minus one standard deviation as bearish.
A chi-square test is a categorical check on whether high and low breadth extremes forecast later market direction better than chance at a declared horizon.
The 30-week series
On the 30-week series, chi-square tests were reported as significant for next-year direction at both standard-deviation thresholds when a high reading was treated as bearish and a low reading as bullish. Contrary-mapping is that reversed label: an elevated long-lookback breadth reading is treated as bearish and a depressed reading as bullish.
A one-standard-deviation rule for the 30-week series presents an elevated reading as bearish and a depressed reading as bullish.
Share of listed stocks above their 30-week moving average, 1964–1969
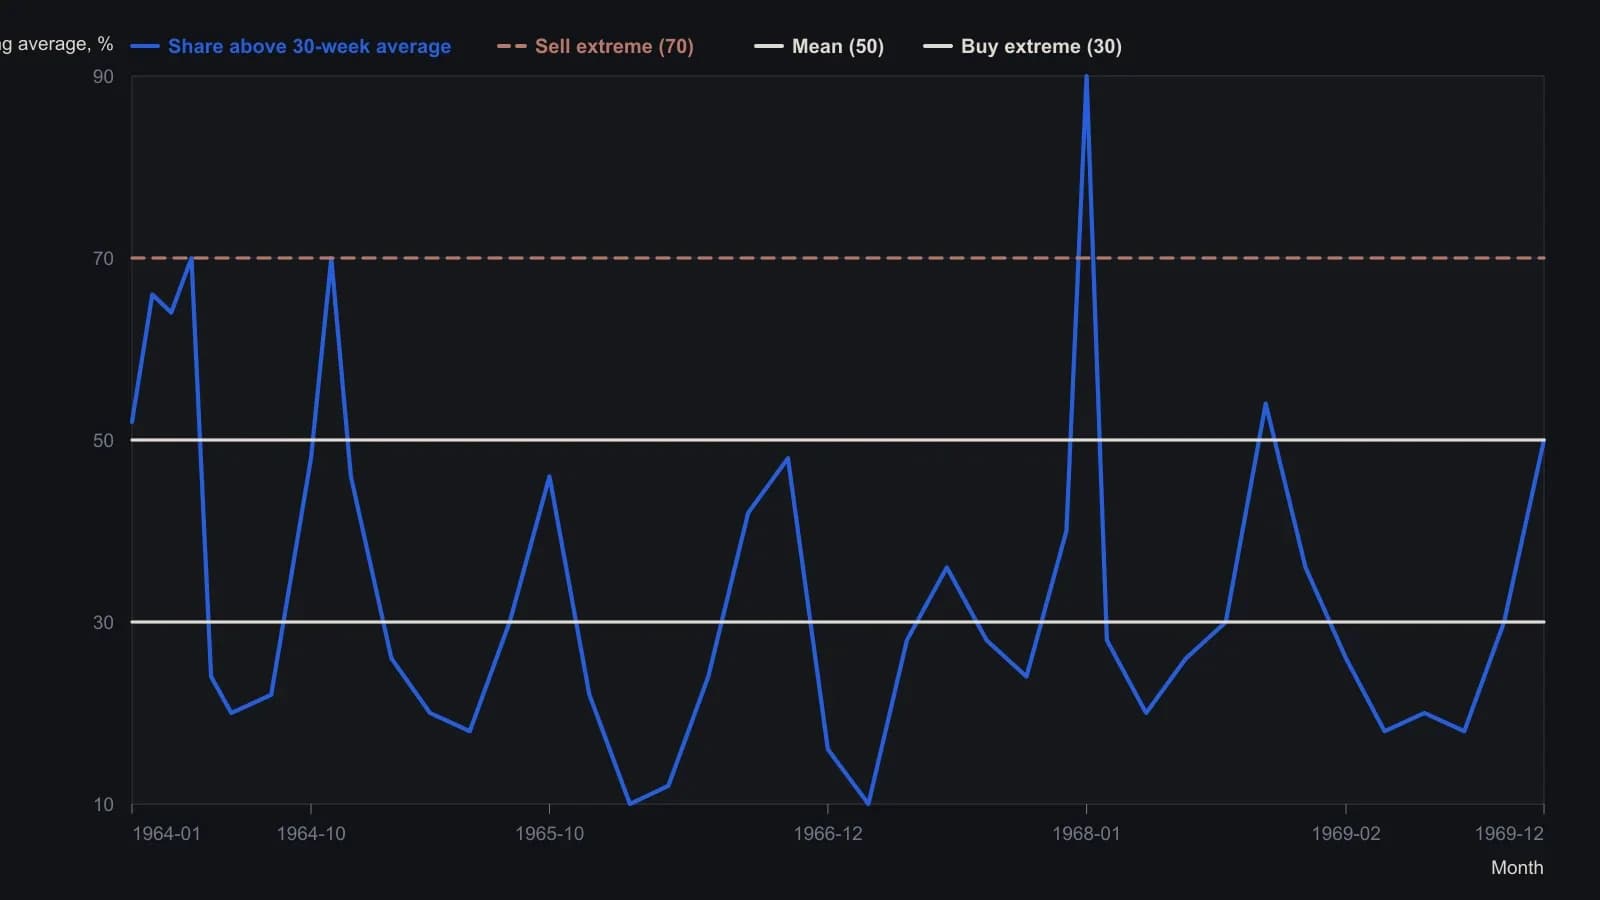
Digitized from the scanned weekly curve against the printed 10-point grid. Placement is approximate to about ±3 to 5 percentage points; thin weekly jigsaw thinner than the raster was not traced tick by tick.
Relative position and the selected watch
A relative-position rule treating more issues above the 30-week average than above the 10-week average as bullish was reported as statistically significant for the next-13-week direction. A growth-company subset produced directional results that paralleled the full listed-issue series while remaining weaker.
The evaluation selected the 30-week share-above-average series as the primary long-horizon watch, mapping high readings as cautionary and low readings as constructive.
All readings on this track · 17 readings
- 1987Testing price-volume agreement after percent reversal filters
- 1988Constructing chi-square tests for two-way price counts
- 1988Building consensus indicators with correlation and the chi-square test
- 1988Test edges against chance, not story
- 1988Constructing an advance-decline divergence oscillator
- 1989Evaluate a contrary put-call premium ratio at a stated horizon
- 1990A weekly resistance-index from hourly volume-per-point
- 1990Testing breadth above moving averages by horizon
- 1990Evaluating member versus odd-lot breadth
- 1990A chi-square test of split frequency histograms across price aggregations
- 1990Evaluating smoothed secondary counts with a chi-square test
- 1991Treat session high and low times as codes, then require a chi-square check
- 1991A signed hourly swing catalog as a next-session chi-square check
- 1992Constructing a chi-square test as a gate for two-way market records
- 1992Percent filters, log point-and-figure, and breadth residuals
- 1997Build a chi-square stationarity screen before you forecast
- 1998Timed breakout rules after a nested-bar contraction