1986issue C031-9
Chi-square tests on price transition matrices
Bin ordered prices into equal-count histogram sectors, tally successive labels in a transition matrix, and compare those counts with the pair frequencies expected under independence. Editorial: repeat the same chi-square test on first differences so a shared level path is not mistaken for sequential memory.
- Randomness and independence are separate properties of a generating process. A series can be random and dependent or non-random and independent.
- Inferring a later price or the sign of a later change from an earlier price assumes the series is non-random, dependent, or both.
- An evaluation sample needs a consistent sampling interval and at least several hundred ordered prices or changes. Equal-count histogram sectors feed a transition matrix whose pair counts are tested against an independence baseline.
- Soybean-meal closing levels from 1 April 1980 through 30 April 1981 produced a nine-cell chi-square of 453.82, indicating dependence. The same procedure on first differences produced 5.581, consistent with independence after the level path is removed.
Randomness is not independence
Randomness and independence are separate properties of a generating process. Randomness is a property in which admissible outcomes are equally likely on a given draw, distinct from whether successive draws influence one another. Independence is a property in which a prior state does not alter the probability of the next state, so pair probabilities factor into the product of the two marginals. A series can be random and dependent or non-random and independent.
Inferring a later price or the sign of a later change from an earlier price assumes the series is non-random, dependent, or both.
An evaluation sample should use a consistent sampling interval and contain at least several hundred ordered prices or changes.
Count sector pairs against an independence baseline
One procedure bins the empirical histogram into histogram-sectors sized so that sectors contain roughly equal numbers of observations. Each observation is recoded as a sector label. Successive labels are tallied in a transition-matrix, a table that records how often one discretized price or change state is followed by each possible next state in an ordered sample.
Under independence, the expected frequency of a sector pair equals the product of the two sector probabilities multiplied by the number of observations. Those expected frequencies are the independence-baseline. The chi-square-test is a goodness-of-fit comparison of observed transition counts with the counts expected if successive binned states were independent.
For nine pair cells, a chi-square below 15.507 at the 95 percent confidence level is treated as consistent with independence.
Raw-price sector pairs vs independence
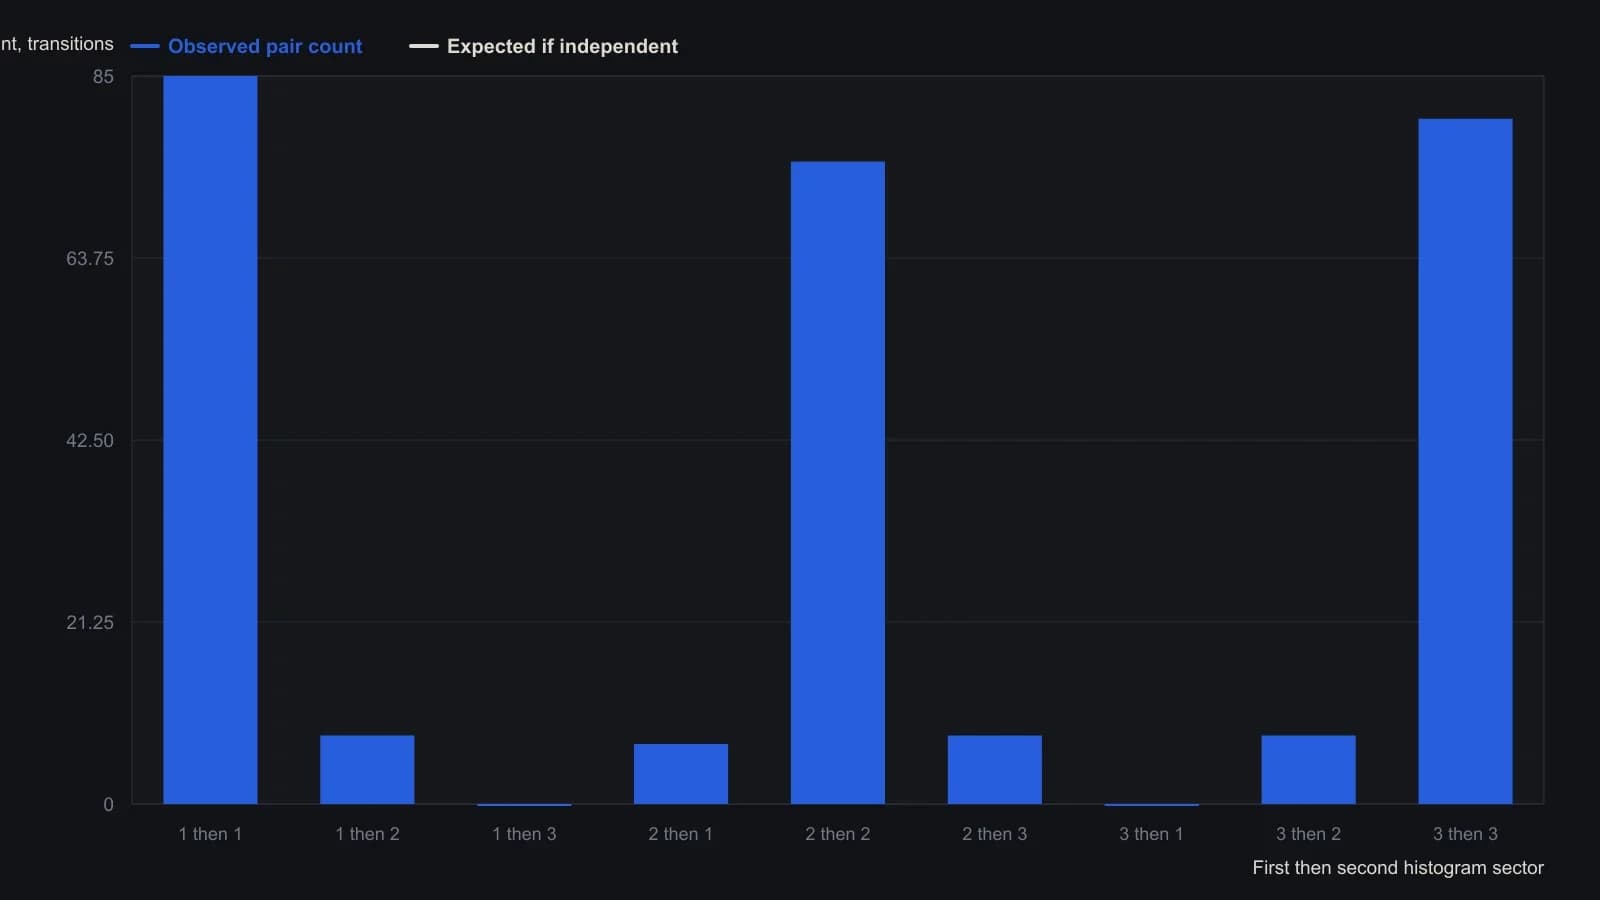
Sectors are equal-count thirds of the price histogram (1: 190–218, 2: 219–244, 3: 245–300). Expected counts use P(1)=0.3542, P(2)=0.3321, P(3)=0.3137 times 271 successive pairs. Critical value 15.507 is the 95% chi-square cutoff stated in the source.
Repeat the test on first differences
On soybean-meal closing levels from 1 April 1980 through 30 April 1981, the nine-cell chi-square on sector transitions was 453.82, indicating dependence relative to the independence baseline.
A first-difference-detrend replaces the raw series with successive signed changes before the dependence test, so a shared level path is removed. Repeating the same sector-and-matrix procedure on first differences produced a chi-square of 5.581, which was not statistically significant and is consistent with independence after the level path is removed.
Recode large versus ordinary changes
The same pipeline can recode large versus ordinary changes. In that sample, assigning moves of 4.00 to 10.00 in either direction as the outer classes also failed to reject independence.
Editorial: Recoding large versus ordinary changes stays inside the same evaluation pipeline. It does not replace the independence-baseline or the first-difference-detrend.
All readings on this track · 6 readings
- 1985A serial-dependence window from signed price transitions
- 1986Chi-square tests on price transition matrices
- 1987Evaluating money-supply serial dependence before a forecast
- 1988Evaluating stationarity, randomness, and dependence in an index series
- 1993Constructing price-change Markov transition matrices
- 1995Collapse correlated inputs via a joint-state chi-square sequence