1990issue C031-3
A weekly resistance-index from hourly volume-per-point
Resistance is defined as volume-per-point. A weekly resistance-index compares declining-hour volume-per-point with advancing-hour volume-per-point, a fourteen-percent-exponential-average smooths that signed series, and a standardized-reading plots the result as a z-score.
- Volume-per-point records shares traded for each one-point price change and is the working measure of how costly it is to move the market.
- A directional-hour-split accumulates the week's average hourly volume and average hourly price change on declining hours and on advancing hours, then compares volume-per-point on those two sides.
- The raw resistance-index is one thousand times declining-hour volume-per-point minus one thousand times advancing-hour volume-per-point, so larger values imply relatively lighter resistance to advances.
- A fourteen-percent-exponential-average smooths the weekly series, and the standardized-reading divides that smooth by its standard deviation so the plotted value is a z-score.
Resistance as a cost of moving price
Resistance is defined as the volume needed to move price one point, recorded as shares traded per point of change. That quantity is volume-per-point: shares traded for each one-point price change, used as the working measure of how costly it is to move the market.
Assembling the series requires hourly price and volume observations, not daily bars alone.
The weekly directional-hour-split
Weekly construction inspects each hour, then compares volume-per-point on declining hours with volume-per-point on advancing hours.
The directional-hour-split classifies each hour as advancing or declining so volume and price-change totals can be accumulated on opposite sides of the week. Declining-hour inputs are the week's totals of average hourly volume and average hourly price change. Advancing-hour inputs are the matching pair on hours that rose.
Signing the raw resistance-index
The resistance-index is the weekly signed contrast: one thousand times declining-hour volume-per-point, minus one thousand times advancing-hour volume-per-point. Higher readings correspond to relatively lighter resistance on advances, because the construction subtracts advance-side volume-per-point from decline-side volume-per-point.
The one-thousand multiplier is used only to present the raw index as a convenient integer.
Smoothing into a standardized-reading
A fourteen-percent-exponential-average, a 14% exponential average applied to the raw weekly series, smooths the resistance-index and is described as approximating a 13-week simple moving average. That recursive smoother is treated as roughly comparable to a 13-week simple average.
After smoothing, the series is divided by its standard deviation so the plotted value is a z-score, or the number of standard deviations from the mean. The standardized-reading is that count of standard deviations from the mean.
Weekly resistance index, 14% exponential average, 1984–1989
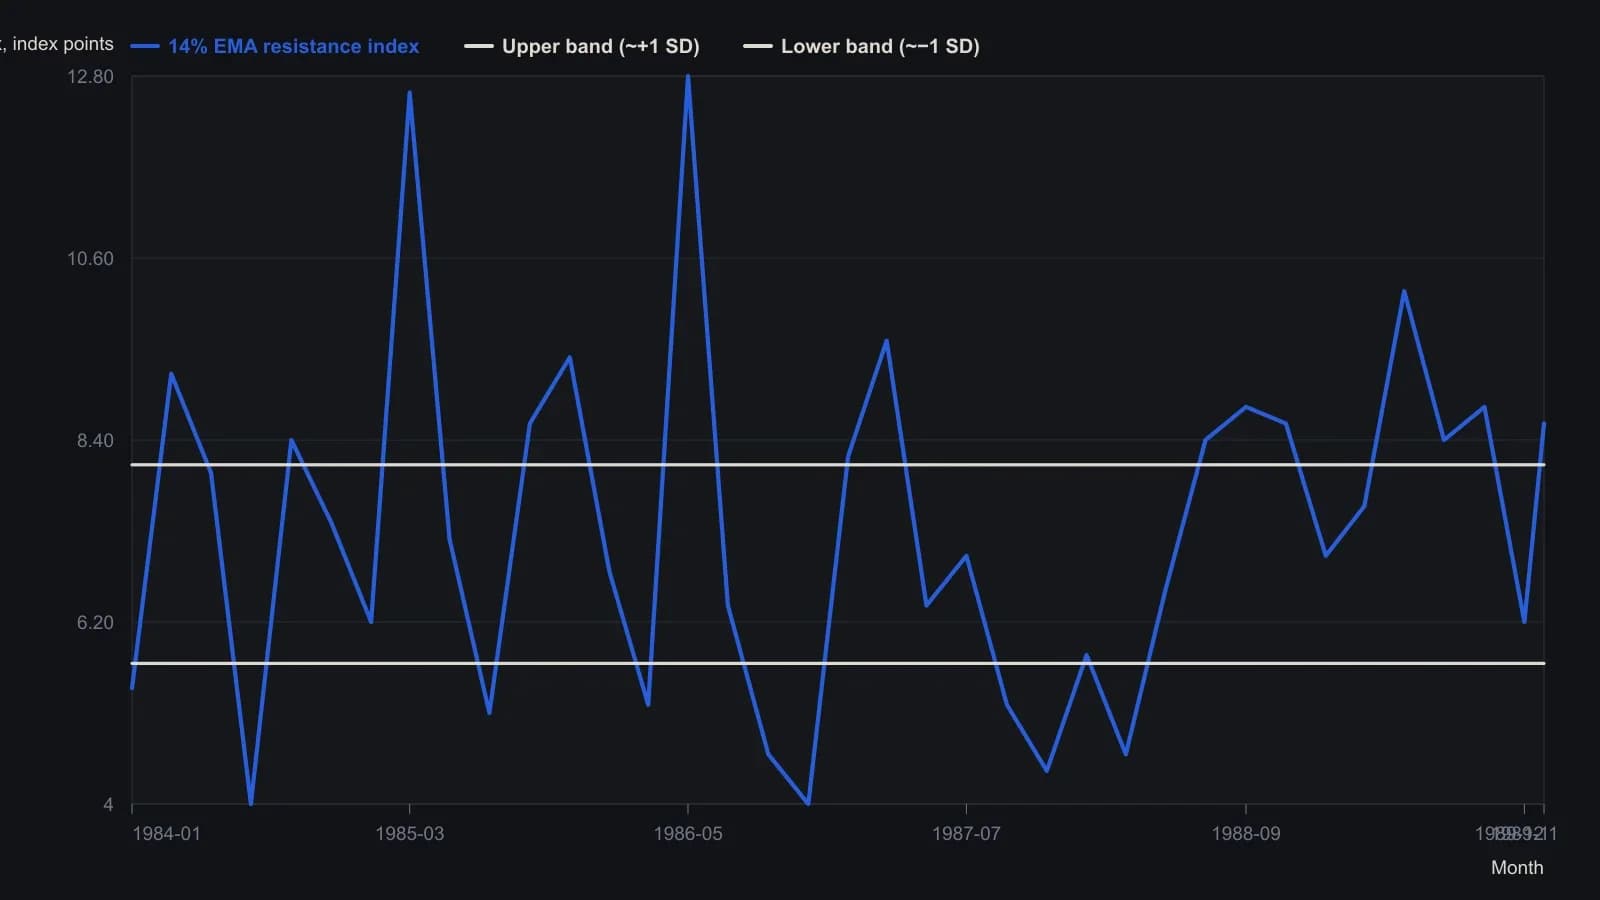
Fourteen-percent exponential average approximates a 13-week simple moving average. Dashed bands on the source figure sit near 5.7 and 8.1, about one standard deviation either side of the mid-period mean. Digitized from the raster; weekly ticks are not labeled, so points are sampled about monthly.
What the later statistical check reported
A chi-square check of subsequent market direction reported a significant rating at a 13-week horizon and weaker results at shorter and longer horizons.
All readings on this track · 17 readings
- 1987Testing price-volume agreement after percent reversal filters
- 1988Constructing chi-square tests for two-way price counts
- 1988Building consensus indicators with correlation and the chi-square test
- 1988Test edges against chance, not story
- 1988Constructing an advance-decline divergence oscillator
- 1989Evaluate a contrary put-call premium ratio at a stated horizon
- 1990A weekly resistance-index from hourly volume-per-point
- 1990Testing breadth above moving averages by horizon
- 1990Evaluating member versus odd-lot breadth
- 1990A chi-square test of split frequency histograms across price aggregations
- 1990Evaluating smoothed secondary counts with a chi-square test
- 1991Treat session high and low times as codes, then require a chi-square check
- 1991A signed hourly swing catalog as a next-session chi-square check
- 1992Constructing a chi-square test as a gate for two-way market records
- 1992Percent filters, log point-and-figure, and breadth residuals
- 1997Build a chi-square stationarity screen before you forecast
- 1998Timed breakout rules after a nested-bar contraction