1985issue C051-4
A serial-dependence window from signed price transitions
Recode successive prices as plus and minus marks, count those transitions against an independence baseline, and treat the last lag that still rejects independence as a time stop. Rebuild the tables as new prices arrive, because that temporal window can change.
- Successive prices on a fixed sampling interval become a signed-price series of plus and minus marks, with ties given an arbitrary sign so the independence baseline stays usable.
- A transition matrix, including lagged tables that skip a fixed number of prices, counts how often each sign is followed by the same sign or the opposite sign.
- A chi-square test compares those observed counts with expected frequencies from the independence baseline and treats values above 18.45 as evidence against independence.
- The last lag that still exceeds the critical value defines a temporal window that functions as a time stop, and the construction is rebuilt as new prices arrive.
Recode prices as plus and minus marks
Successive prices on a consistent sampling interval are first recoded as plus or minus marks by comparing each observation with the next one. The result is a signed-price series: a sequence of plus and minus marks on that fixed interval.
Equal consecutive prices are given an arbitrary sign because leaving ties unresolved greatly increases the theoretical and computational burden of the independence baseline.
Tally transitions and lagged pairs
A transition matrix tallies how often a plus is followed by a plus or a minus and how often a minus is followed by a plus or a minus. It is a count table of how often each signed price step is followed by the same sign or the opposite sign.
Lagged transition matrices pair observations that skip a fixed number of intervening prices so the duration of serial dependence can be measured. Serial dependence here means that the sign of a later price change is statistically associated with an earlier sign.
Test the counts against independence
A chi-square goodness-of-fit statistic compares each observed cell count with its expected count. Values above 18.45 are treated as evidence against independence.
In a 272-price daily-close sample the observed ++, +-, -+, and -- counts were 80, 64, 64, and 62 against expected values of 45.33 for each same-sign cell and 90.67 for each opposite-sign cell, producing a chi-square of 51.73. The first 11 lagged matrices in that sample all exceeded 18.475, so serial dependence extended across at least 10 intervening days.
Turn the last rejecting lag into a time stop
The last lag that still exceeds the critical value defines a temporal window: the span, in sampling intervals, over which lagged transition counts remain inconsistent with independence. That window functions as a time stop, a holding bound set to the last lag whose transition matrix still rejects independence, so remaining exposure is closed when that window ends.
The transition-matrix and chi-square construction is rebuilt as new prices arrive because that window length can change.
Soybean-meal chi-square by signed-price lag
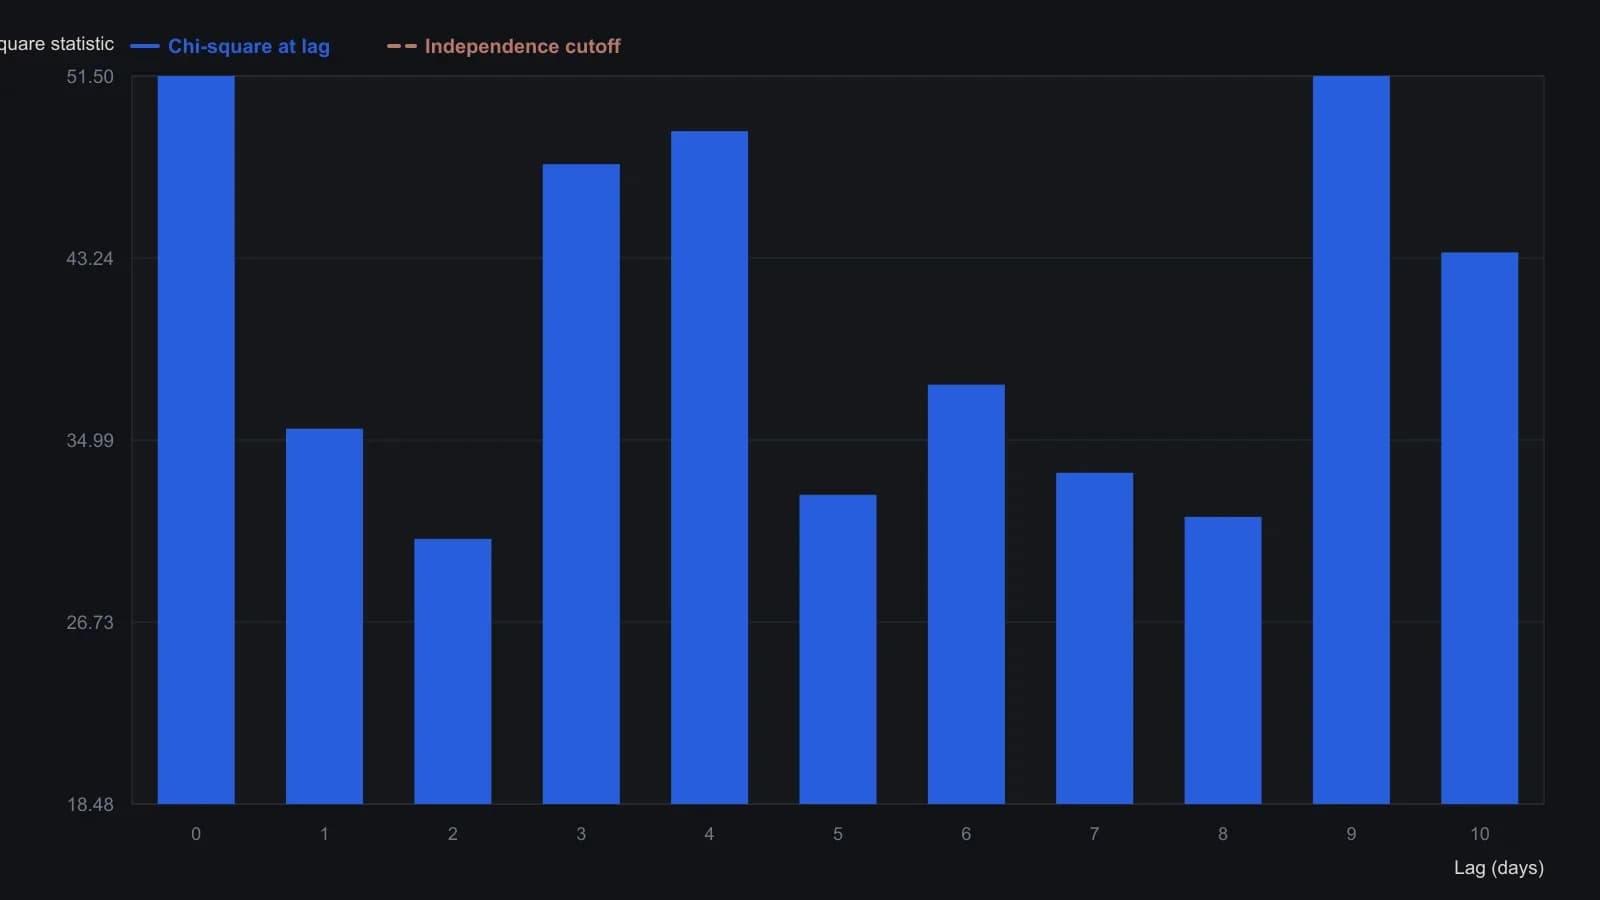
Sample is daily soybean-meal closes from 4/1/80 to 4/30/81 (272 prices). Independence baseline uses P(same sign)=1/6 and P(sign flip)=1/3. Digitized bar heights are approximate; the source does not print the eleven chi-square values.
All readings on this track · 6 readings
- 1985A serial-dependence window from signed price transitions
- 1986Chi-square tests on price transition matrices
- 1987Evaluating money-supply serial dependence before a forecast
- 1988Evaluating stationarity, randomness, and dependence in an index series
- 1993Constructing price-change Markov transition matrices
- 1995Collapse correlated inputs via a joint-state chi-square sequence