1986issue C091-3
Chi-square test for clustered price-change histograms
Large price increases can be placed into weekday bins with a triggered price-change histogram and then compared with a flat expected-frequency baseline. The n-method forms a chi-square statistic from those observed and expected counts so a visual pile can be judged against a formally uneven distribution.
- Large price increases and decreases can be checked for even versus uneven placement across a trading day, week, or month.
- A triggered price-change histogram can assign each week's first large increase to weekday bins, using the first session of the trading week as the trigger.
- Under an even-distribution baseline, the worked five-cell histogram of 46 large-increase observations has an expected frequency of 9.2 in each cell.
- A calculated chi-square that equals or exceeds the critical tabulated value for degrees of freedom equal to the number of bins minus one is treated as statistically significant.
Even versus uneven placement
Large price increases and decreases can be checked for even versus uneven placement across a trading day, week, or month. A pile of large moves on one weekday can look concentrated while remaining only a visual impression.
Editorial: treat a weekday pile-up of large price moves as an unevaluated visual hypothesis. The next step is to bin the moves and score the histogram against a flat expected-frequency baseline.
Weekday pile-up of large soybean-meal price increases
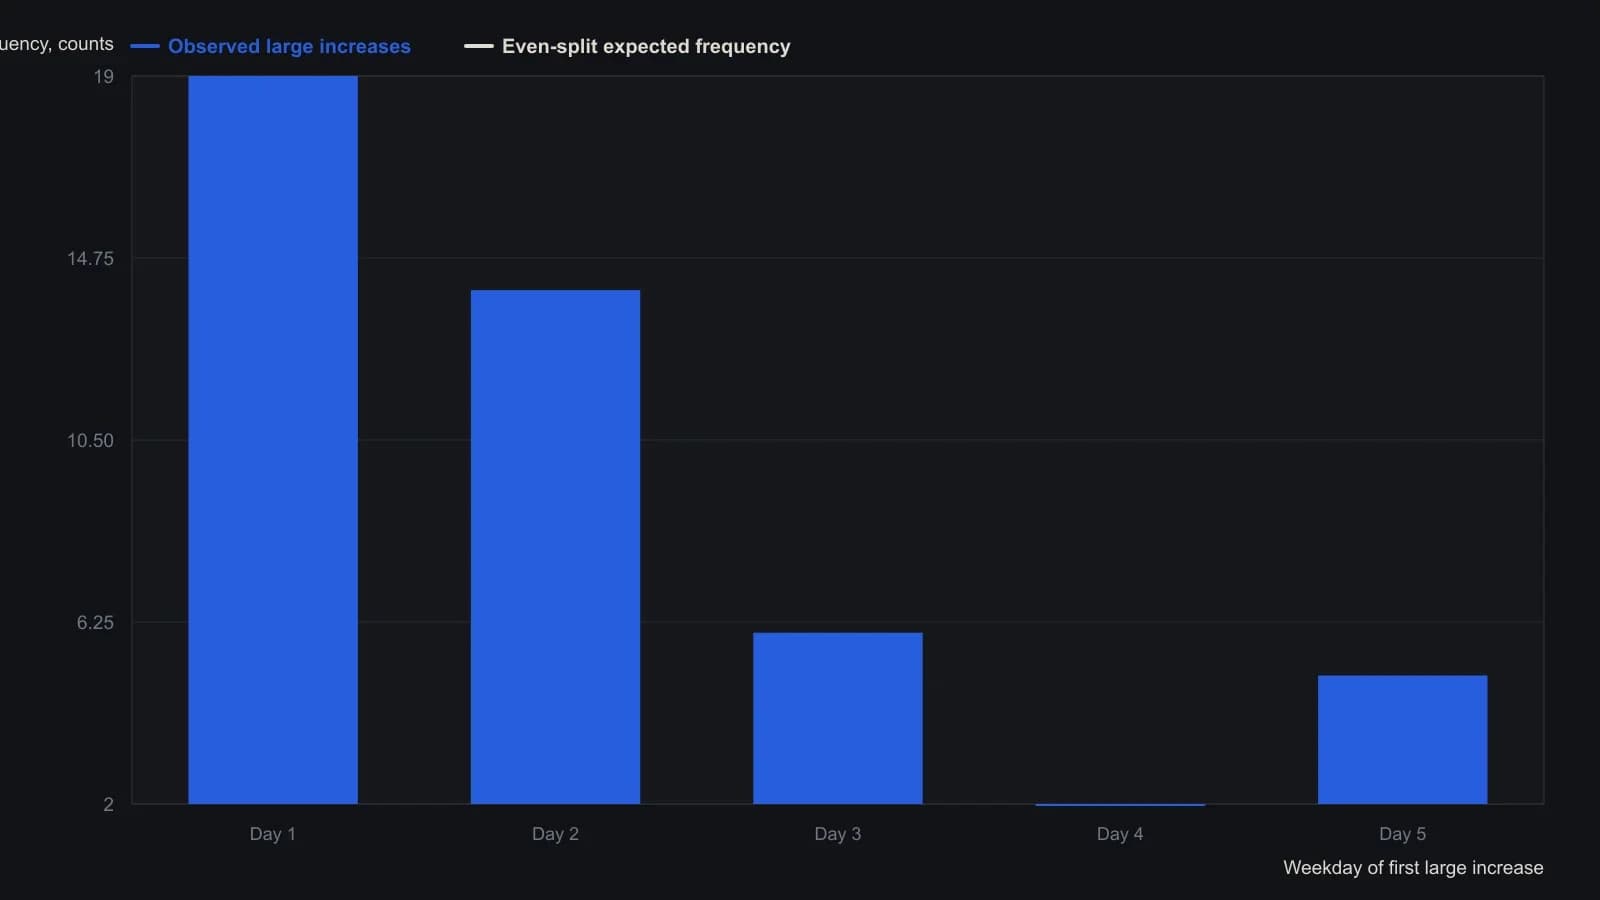
Trigger is the first day of the trading week. The article reports chi-square 21.60 versus the 9.2 even baseline, with 4 degrees of freedom.
Triggered price-change histogram
A triggered price-change histogram is a binning of large price changes in which each observation is the first large move after a defined calendar trigger, such as the opening session of a trading week. In the historical workflow, that trigger assigned each week's first large increase to weekday bins, using the first session of the trading week as the starting point.
The worked histogram placed 46 large-increase observations into five cells. The observed cell frequencies were 19, 14, 6, 2, and 5.
Expected frequency under an even baseline
The n-method is a chi-square comparison of observed histogram bin counts with the counts that would appear if large price changes were spread evenly. Under an even-distribution baseline, each of those five cells has an expected frequency of 9.2 observations. Expected frequency is the count each histogram cell would hold if the large increases were spread evenly.
Chi-square statistic and degrees of freedom
The chi-square statistic formed from those observed and expected frequencies equals 21.60. Degrees of freedom for this test equal the number of histogram bins minus one, and that figure is used when a calculated chi-square is compared with a critical tabulated value.
A calculated chi-square that equals or exceeds the critical tabulated value for those degrees of freedom is treated as statistically significant. Editorial: that comparison is how a suggestive clustering can be separated from a formally uneven distribution.
All readings on this track · 7 readings
- 1986Constructing price-change density histograms and symmetry tests
- 1986Calendar-locked averaging of price-change histogram categories
- 1986Chi-square test for clustered price-change histograms
- 1988Empirical price-change counts versus borrowed statistics
- 1991Constructing tick engines to match price-change histograms
- 1996Constructing a price occupancy histogram and a smoothed mobility reading
- 2003Treat an opening gap as a completed session event