1986issue C041-7
Constructing price-change density histograms and symmetry tests
After session-to-session price changes are assigned to ordered classes, a price-change density histogram or a triggered price-change histogram is assembled from trading-day bins. Independence is then checked by pairing complementary bins and running a chi-square goodness-of-fit against the symmetry hypothesis.
- A price-change density histogram places each occurrence of a chosen class just left of a row of trading-day bins and tallies the lag to the next occurrence of that class.
- A triggered price-change histogram aligns a calendar start, such as the first session of a trading week or month, with the first bin and records when the first chosen class appears.
- Independence is checked by reading the signed histogram as a differential spectrum and applying a chi-square goodness-of-fit of each positive-side frequency with its complementary negative-side frequency, after complementary-bin-merge.
- Editorial: the symmetry hypothesis can be accepted or rejected only after the class cuts, the lag or calendar bins, and the empty-bin pairing rule are written down.
A classed price-change sequence is an ordered list in which each session-to-session price change is assigned to a rank class such as a lower third, a middle third, or an upper third. After that assignment, a price-change density histogram is built by placing each occurrence of a chosen class just left of a row of trading-day bins and tallying the lag to the next occurrence of that class.
Choose the trading-day bins
The density construction uses one trading-day bin per trading session. Weekends and holidays are omitted by default. About 30 bins are treated as generally enough.
Worked large-up and large-down classes
In the worked large-up class labeled 3 and spanning +1.90 to +10.0, the completed density histogram gave a 0.73 probability that another 3 appears within three days.
In the worked large-down class labeled 1 and spanning -10.0 to -1.20, the same-class follow-on probability was 0.45. Another 1 was described as appearing within nine days at most.
Higher-order density and other class cuts
A higher-order density chart started from two successive 3s. It placed the next 3 within three to five days with probability 0.49 and within 14 days with probability 0.94.
Class cuts may be changed to fifths, eighths, or a tighter large-up band such as +4.0 to +10.0.
Align a calendar trigger
A triggered price-change histogram aligns a calendar start, such as the first session of a trading week or month, with the first bin and tallies when the first chosen class appears. In the weekly example a 3 was most likely on the first trading day, with probability 0.36. Non-trading days may be inserted as blank slots if calendar spacing is wanted.
Density of large-up (class 3) waits
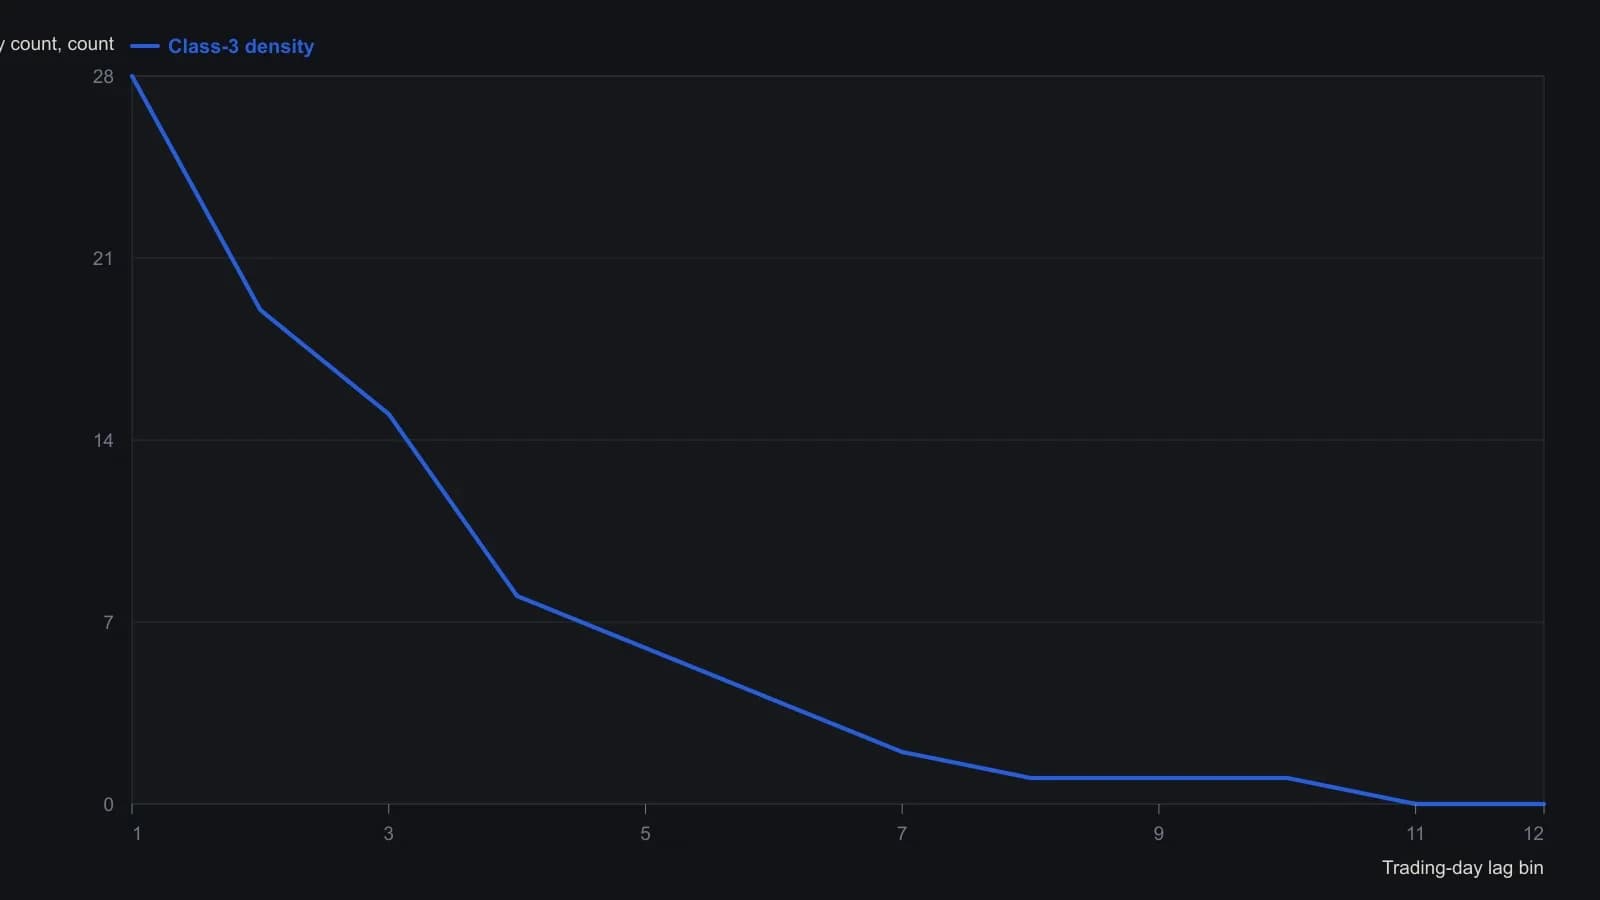
Bins are trading days only; weekends and holidays are omitted. Class 3 is the large-up third from the prior article, +1.90 to +10.0. The source states P(next 3 within 3 days) = 0.73, which matches the first three bars over the digitized total.
Read the signed histogram as a differential spectrum
Independence is checked by reading the signed price-change histogram as a differential spectrum that should be symmetric about zero. A chi-square goodness-of-fit then compares each positive-side frequency with its complementary negative-side frequency.
The symmetry hypothesis is the working claim that independent price changes should form a frequency table balanced around zero. That claim is accepted or rejected by the chi-square check.
Write the complementary-bin-merge rule
An empty signed bin is merged with the next higher bin until the count exceeds one, and the same number of cells is merged on the opposite side. On the supplied histogram the -0.6 and -0.7 bins totaled 5 and the +0.6 and +0.7 bins totaled 3.
Accept or reject the symmetry hypothesis
After merging, the worked table had 44 bins with frequency of one or more, a chi-square of 103.72, and 43 degrees of freedom. In this construction, degrees of freedom are the number of retained bins minus one.
The accompanying normal-scale check equaled 5.129, which exceeded 1.96 and was read as significant asymmetry. That sample of price changes was not treated as independent.
All readings on this track · 7 readings
- 1986Constructing price-change density histograms and symmetry tests
- 1986Calendar-locked averaging of price-change histogram categories
- 1986Chi-square test for clustered price-change histograms
- 1988Empirical price-change counts versus borrowed statistics
- 1991Constructing tick engines to match price-change histograms
- 1996Constructing a price occupancy histogram and a smoothed mobility reading
- 2003Treat an opening gap as a completed session event