1999issue C081-4
Finish the entry from one value-at-risk band
A stop taken only from account-level pain ignores how much the security typically fluctuates. The archive workflow builds a one-horizon value-at-risk band from continuously compounded returns, then uses that same band to cap share count and to place the stop at the matching price.
- A stop set only from account-level loss tolerance, such as a 4 percent hit on a 100000 unit account, records personal risk aversion and ignores the security's typical price fluctuation.
- Price-volatility measures in-between fluctuation of percentage changes, not net direction, and is the standard deviation of continuously-compounded-return observations.
- Value at risk is the money that may be lost over a fixed horizon at a chosen probability, taken from the return mean, the return standard deviation, and a confidence-coefficient.
- Volatility-position-sizing divides the dollar risk budget by the estimated downside value-at-risk percentage, and the stop-loss is the price consistent with that same budgeted loss.
The entry is unfinished without a loss band
Editorial reading: treat a technical entry as unfinished until a one-horizon loss band is taken from the security's own return volatility and then used twice. One pass scales the share count so a precommitted dollar budget cannot be exceeded. The other pass places the stop at the price that marks that same budget.
Account pain is not a volatility measure
A stop set only from account-level loss tolerance, such as a 4 percent hit on a 100000 unit account, uses personal risk aversion and ignores the security's typical price fluctuation.
Two paths can share endpoints and differ in fluctuation
Two price paths that start and end at the same levels can have different volatilities because volatility measures in-between fluctuation, not net direction. Price-volatility is that dispersion of percentage price changes along the path, not the net direction from the start of an interval to its end.
The band is built from continuously compounded returns
Volatility is quantified as the standard deviation of continuously compounded percentage price changes, using the natural log of last price over the prior-period price. The continuously-compounded-return is that log observation. Its mean and standard deviation feed the value-at-risk band.
Prices and percentage changes do not share a shape
Raw price levels tend toward an asymmetric, log-normal-like shape because prices cannot go negative, while percentage changes are more nearly symmetric. A normal model still omits fat tails and skew.
Value at risk is money at a chosen probability
Value at risk for a single position is the money that may be lost over a fixed horizon at a chosen probability, computed as mean plus or minus a confidence-coefficient times the return standard deviation. Illustrative coefficients are 1.645 for a 90 percent interval, 1.96 for 95 percent, and 2.326 for 99 percent. Raising the confidence level widens the value-at-risk figure.
A long position reads the lower tail
A long position uses the lower tail of that band. A 90 percent two-sided interval leaves a 5 percent chance of a worse loss, also described as 95 percent confidence of not exceeding the downside percentage.
Share count uses the band before entry
Volatility-position-sizing divides the dollar risk budget by the estimated downside value-at-risk percentage so share count is bounded by both aversion and measured volatility before entry. The filter takes account equity, the dollar loss budget, and the security's estimated volatility so exposure stays inside that budget.
The stop marks the same budgeted loss
The stop-loss is then the price consistent with that budgeted, volatility-implied loss, rather than a round number chosen from discomfort alone. It is a pre-entry and in-trade filter that keeps the exit aligned with the same budget used to set the share count.
IBM weekly closes with the value-at-risk stop and the comfort stop
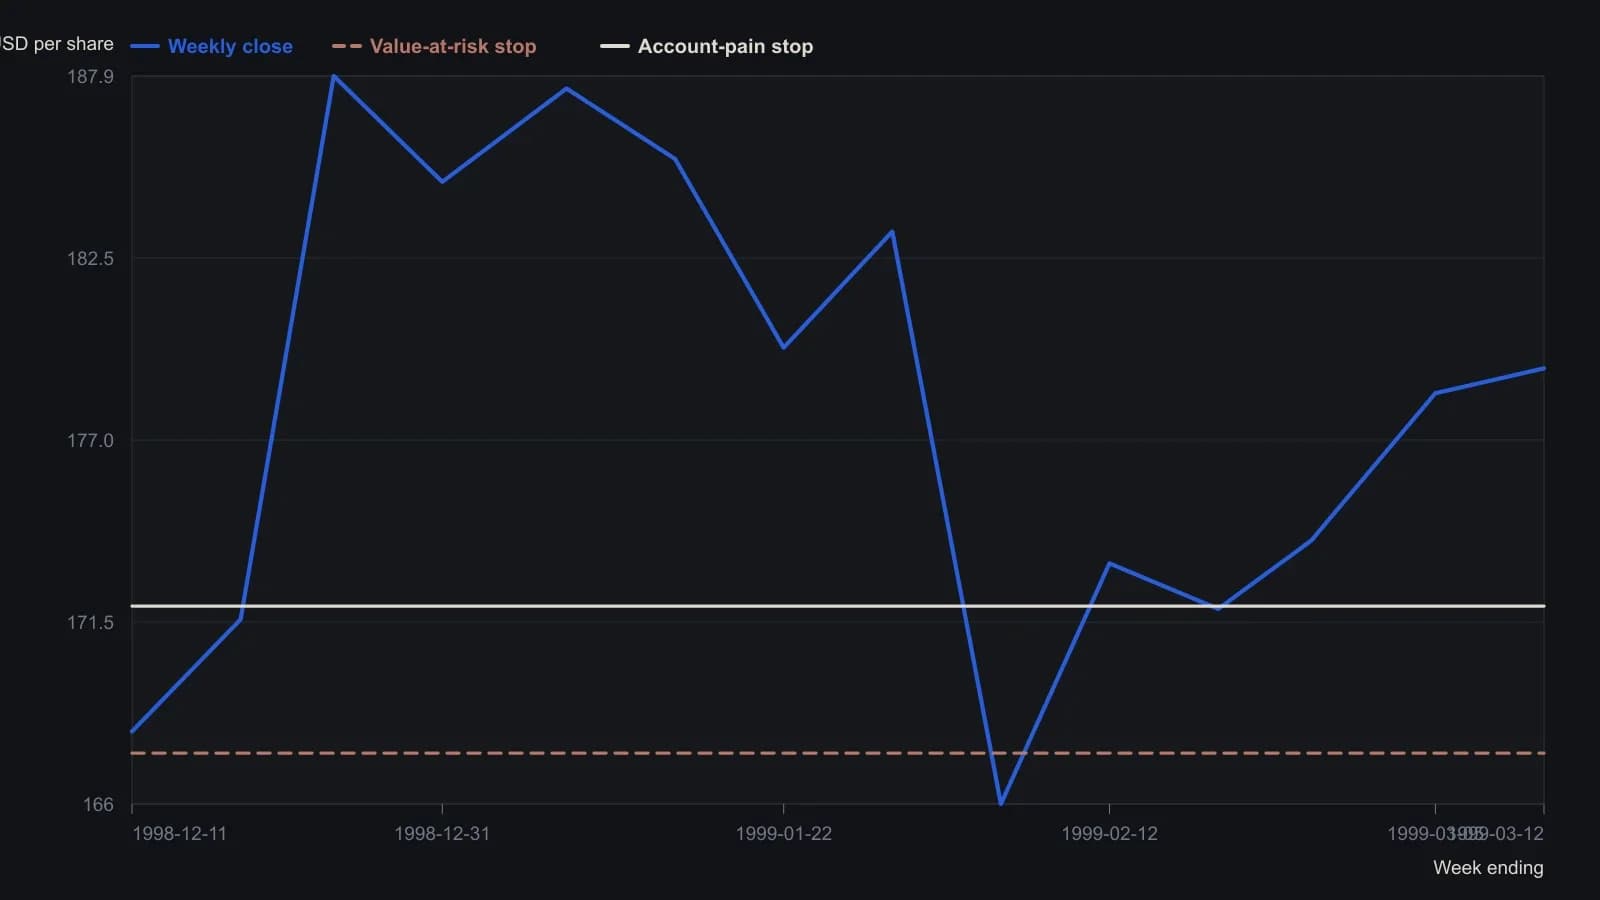
Both horizontal prices apply to the 12 March 1999 entry, not as trailing stops on earlier weeks. Weekly log-return mean 0.485 percent and standard deviation 4.364 percent; the lower band is mean minus 1.6448 standard deviations, converted back as 179.13×exp(−0.06474)≈167.53. The author notes fat tails and then sets them aside.