2017issue C0944-45
Screening ETFs by liquidity, index fit, and rank
Free ETF research sites could be used as a construction lab: run a liquidity filter first, place each surviving name against an index proxy, then apply a rank rotation only to the names that still qualify.
- Active traders used average-volume lists as a liquidity filter, hunting for volume and narrow bid-ask spreads before choosing an executable ETF.
- Category listings, six-fund comparison tables, and industry heatmaps supported an index proxy so one name could be read against peers, allocations, and group size.
- Independent site ratings from 1 to 10 could serve as a rank rotation layer among names that had already passed a liquidity and category screen.
- By year-end 2016 the US market already listed 1716 ETFs, and one free finder opened on 2031 funds with 14 user-chosen criteria, which is why a staged screen was useful.
A catalogue large enough to need a screen
By year-end 2016 the US ETF market included 1716 funds with assets of nearly 2.524 trillion. As of June 14, 2017 the five largest ETF issuers by assets were BlackRock at 1.2 trillion, Vanguard at 741.4 billion, State Street Global Advisors at 547.2 billion, Invesco PowerShares at 126.6 billion, and Charles Schwab at 77.4 billion.
One free ETF finder opened on a table of 2031 funds and used 14 user-chosen selection criteria, with results split across eight information tabs.
Editorial reading: that catalogue is large enough that a staged construction lab is more useful than an unsorted browse of the full table.
Keep only names you can trade
A volume ranking of popular ETFs placed a financial-sector fund ahead of a broad-market fund, with a short-term volatility product and a gold-miners fund third and fourth, and two volatility ETFs inside the top 10.
Active traders used average-volume lists specifically to hunt for liquidity and narrow bid-ask spreads before choosing an executable ETF. That practice is a liquidity filter: a pre-trade screen that keeps only ETFs with enough volume, tight enough spreads, and acceptable trading costs to be executable.
Editorial reading: a volume list can put a volatility product ahead of a broad-market fund. Liquidity is the first gate, not a judgment of what belongs in a diversified lineup.
Most-traded ETFs by average volume
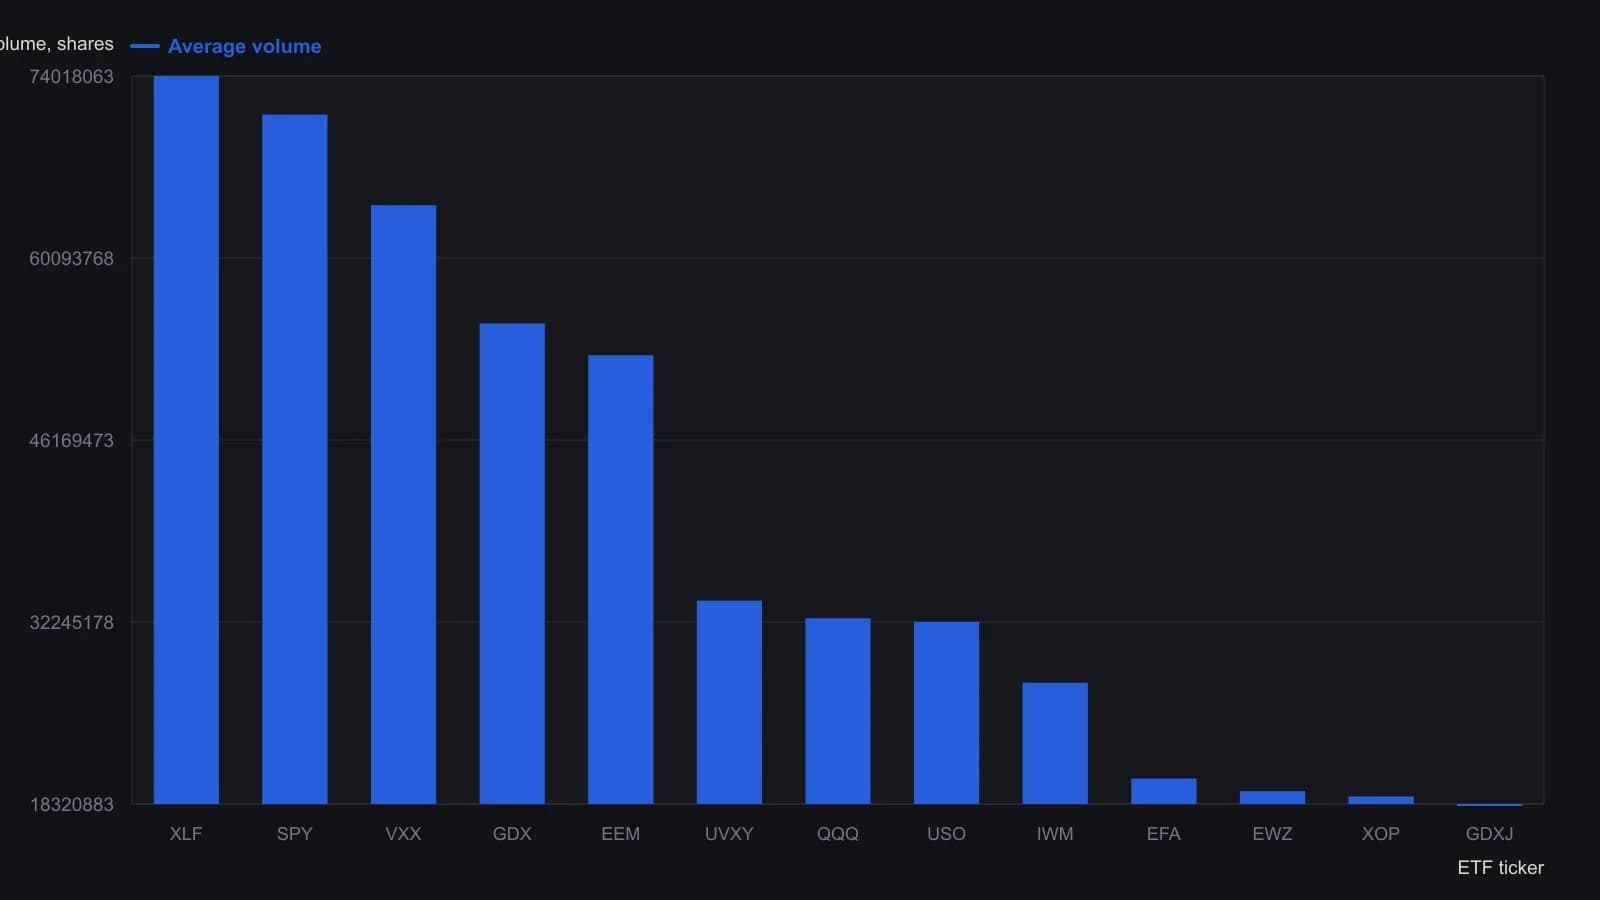
The printed clip is the top of that volume ranking. The site's averaging window is not restated in the article.
Read each candidate against a stand-in
Category listings paired each ETF with expense ratios, assets, average daily volume, and year-to-date returns so peers could be compared on both cost and trading activity.
ETF comparison tools allowed up to six funds to be lined up on ratings, price data, static data, asset class, and performance, including sector, country, and market-cap allocation.
Industry heatmaps colored one-month performance from worst to best and also reported the number of ETFs and assets in each group so a single name could be read against its category.
Those tools support an index proxy: a comparison of one ETF against a broader market, sector, or category stand-in so a single name is judged in diversified context rather than in isolation.
Rank only the names that remain
Independent site ratings scored ETFs from 1 to 10 and could be used as a free ranking layer when rotating among names that already passed a liquidity and category screen.
That last step is a rank rotation: a repeatable ranking procedure that orders candidates and decides which names to hold, replace, or skip for the system holding period.
Editorial reading: the scores from 1 to 10 are a ranking layer after the liquidity filter and the index proxy have already cut the list. Ranking the full finder table skips that construction order.
All readings on this track · 19 readings
- 1992Country regime inside global allocation and index proxies
- 1992Intermarket confirmation for long-duration bond-fund timing
- 1993Paired bond and currency proxies with weekly crossover confirmation
- 1995Walk-forward evaluation of a municipal futures timed fund switch
- 1999Regime-gated allocation with bounded index leverage
- 1999Testing trend following with cash-price controls
- 2002A capital-preservation case for index-proxy allocation
- 2003A shared weekly-average grid for four Asian index proxies
- 2005Index-etf-core weights, a growth-index-clock, and an implementation-cost-ledger
- 2005European index proxies as one weekly-regime panel
- 2006Index-fund proxies as intermarket regime instruments
- 2006Constructing metal option exposure with mining proxies and implied volatility
- 2010Matched straddles on levered versus unlevered index proxies
- 2013Inheritance as an index-proxy and allocation case
- 2014Headline index levels mix a changing basket with a changing divisor
- 2017Screening ETFs by liquidity, index fit, and rank
- 2019Leveraged commodity proxies fail the futures test
- 2020Constructing pre-listing paths for new fund sleeves
- 2020A sleeve after cost-drag, judged by an index-proxy, sized in a stock-bond mix