2005issue C011-3
Index-etf-core weights, a growth-index-clock, and an implementation-cost-ledger
A historical five-step sequence builds an index-etf-core from capitalization and style funds, times the growth sleeve with a growth-index-clock, holds three industry baskets beside the core, and lines up expense ratios, commissions, and manager fees on an implementation-cost-ledger.
- The construction sequence is presented as five steps covering timing, intermediation, an index-fund array, a core risk mix, and account-level execution.
- The index-etf-core assigns 15 percent to each of four style-and-size funds and 10 percent to each of two broad size funds, then adds three industry baskets at 5 percent each and 5 percent cash.
- The growth-index-clock enters after an S&P 500 BARRA Growth absolute decline lasting more than one year and exits after an absolute advance lasting more than two years, then applies a value-overweight-defense.
- On a 100000 notional, the implementation-cost-ledger lists expense ratios of 0.06 percent to 0.20 percent, a 10-unit commission cap, 158 in annual fund expenses plus 90 in commissions, a 2.4 percent manager fee line, and a 1.75 percent fund-complex expense line.
A five-step construction sequence
The construction sequence is presented as five steps covering timing, intermediation, an index-fund array, a core risk mix, and account-level execution.
The index-etf-core
The index-proxy set spans large-cap value, large-cap growth, small-cap value, small-cap growth, large-cap blend, and mid-cap blend benchmarks.
Illustrated core weights assign 15 percent to each of four style-and-size funds and 10 percent to each of two broad size funds, totaling 80 percent. That sleeve is the index-etf-core.
The remaining invested sleeve is three industry baskets at 5 percent each, bringing the invested share to 95 percent with 5 percent cash.
The growth-index-clock
Growth-fund entry is tied to an S&P 500 BARRA Growth absolute decline lasting more than one year, and exit to an absolute advance lasting more than two years. That rule is the growth-index-clock.
Sale of the growth funds is followed by a value-overweight-defense: an overweight in the paired value funds until a later rebalance after a subsequent multi-year decline.
The growth-index timing rule is described as holding from 1979 through 2003 except during 1998-2001.
Moving 5-year annualized returns: S&P 500 vs growth vs value
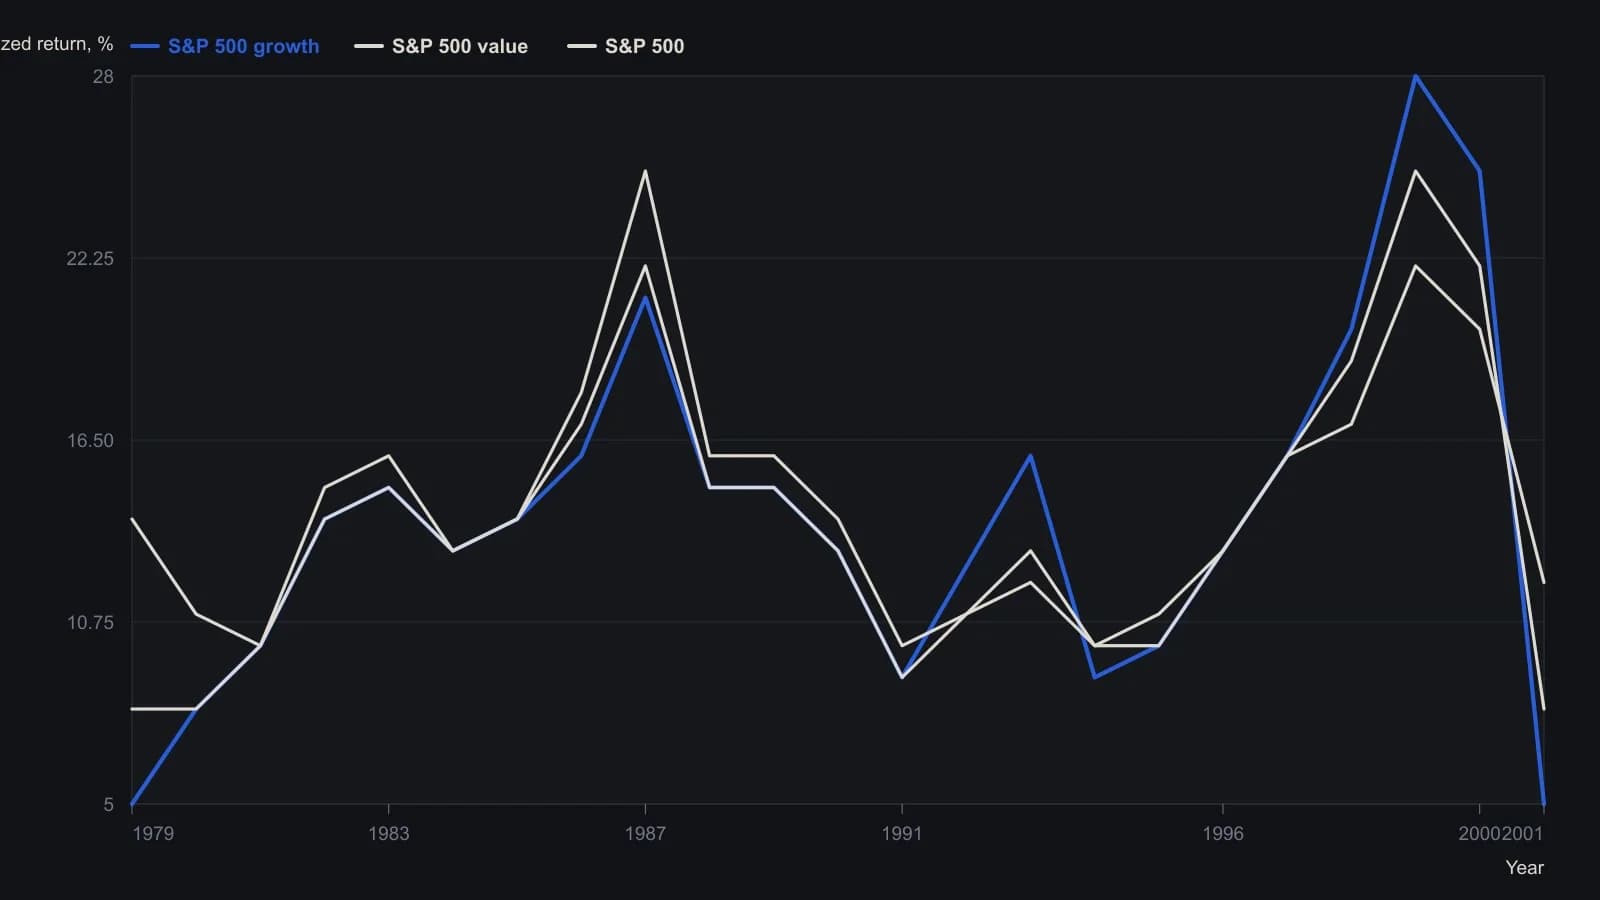
Digitized from the raster of Figure 4 (Moving 5-year Annualized Return). Readings are to the nearest 1 percentage point. The printed series break around 1991–92; that gap was left unfilled. The source itself flags 1998–2001 as anomalous.
The industry-basket-sleeve
Industry baskets are rotated after a one-year high above the purchase price.
Editorial reading: each industry-basket-sleeve is a same-industry index holding used to express a sector view without single-name concentration.
The implementation-cost-ledger
A 100000 notional illustration lists fund expense ratios between 0.06 percent and 0.20 percent and a 10-unit commission cap per trade.
The same illustration lists 158 in annual fund expenses plus 90 in commissions, a 2.4 percent manager fee line, and a 1.75 percent fund-complex expense line.
Editorial reading: an implementation-cost-ledger is a side-by-side tally of those fund expense ratios, ticket commissions, and manager or complex fees on a fixed notional.
All readings on this track · 19 readings
- 1992Country regime inside global allocation and index proxies
- 1992Intermarket confirmation for long-duration bond-fund timing
- 1993Paired bond and currency proxies with weekly crossover confirmation
- 1995Walk-forward evaluation of a municipal futures timed fund switch
- 1999Regime-gated allocation with bounded index leverage
- 1999Testing trend following with cash-price controls
- 2002A capital-preservation case for index-proxy allocation
- 2003A shared weekly-average grid for four Asian index proxies
- 2005Index-etf-core weights, a growth-index-clock, and an implementation-cost-ledger
- 2005European index proxies as one weekly-regime panel
- 2006Index-fund proxies as intermarket regime instruments
- 2006Constructing metal option exposure with mining proxies and implied volatility
- 2010Matched straddles on levered versus unlevered index proxies
- 2013Inheritance as an index-proxy and allocation case
- 2014Headline index levels mix a changing basket with a changing divisor
- 2017Screening ETFs by liquidity, index fit, and rank
- 2019Leveraged commodity proxies fail the futures test
- 2020Constructing pre-listing paths for new fund sleeves
- 2020A sleeve after cost-drag, judged by an index-proxy, sized in a stock-bond mix