1991issue C111-4
Evaluating quarterly return runs with historical analogs
A runs-test scores a live signed quarterly-return sequence by run-extent and run-duration. Historical-analog-comparison then ranks that run against completed same-sign historical runs.
- Signed quarterly total-return sequences can be partitioned into same-sign runs and scored by run-extent and run-duration.
- A runs-test counts consecutive same-sign quarterly total-return observations until an opposite-sign quarter interrupts the up-move or down-move.
- Historical-analog-comparison places a live signed-return run beside completed historical runs of the same sign and ranks them by cumulative extent and duration.
- In the evaluation record, many up-moves exceeded a 25 percent run-extent, while down-moves rarely did so without an interrupting quarter and rarely lasted more than two or three quarters.
Scoring signed quarterly runs
Signed quarterly total-return sequences can be partitioned into same-sign runs and scored both by percentage extent and by duration in quarters. Run-extent is the cumulative percentage total return accumulated across one uninterrupted signed run. Run-duration is the number of consecutive quarters that keep the same return sign.
A runs-test is a count of consecutive same-sign quarterly total-return observations used to measure how long an advance or decline persists before an opposite-sign quarter interrupts it. An up-move is a run of consecutive quarters with positive total return. A down-move is a run of consecutive quarters with negative total return.
What the completed runs showed
The evaluation sample is quarterly average total returns on a capitalization-weighted industrial equity index from 1940 through the second quarter of 1991.
In that record, many positive quarterly runs exceeded a 25 percent cumulative total return, while very few negative quarterly runs exceeded 25 percent without an interrupting quarter. Negative quarterly runs rarely lasted more than two or three consecutive quarters, whereas positive quarterly runs were less regular in length and more often continued longer.
The negative-run group placed above 25 percent contained two tabulated extents: 32.6 percent and 33.5 percent. Positive-run durations grouped as longer than four quarters included lengths of 5, 7, 7, 10, 6, 5, 11, 5, and 5 quarters. Negative-run durations grouped as longer than four quarters included two sequences of 6 quarters each.
Ranking a live up-move
Historical-analog-comparison is a side-by-side placement of a live signed-return run against completed historical runs of the same sign, ranked by cumulative extent and duration.
A then-current positive run of three consecutive quarters and a 25 percent gain was compared with 41 completed positive runs, of which 14 later posted larger cumulative gains and 15 later posted longer durations.
Up-move extent by size class, S&P 500 Industrials
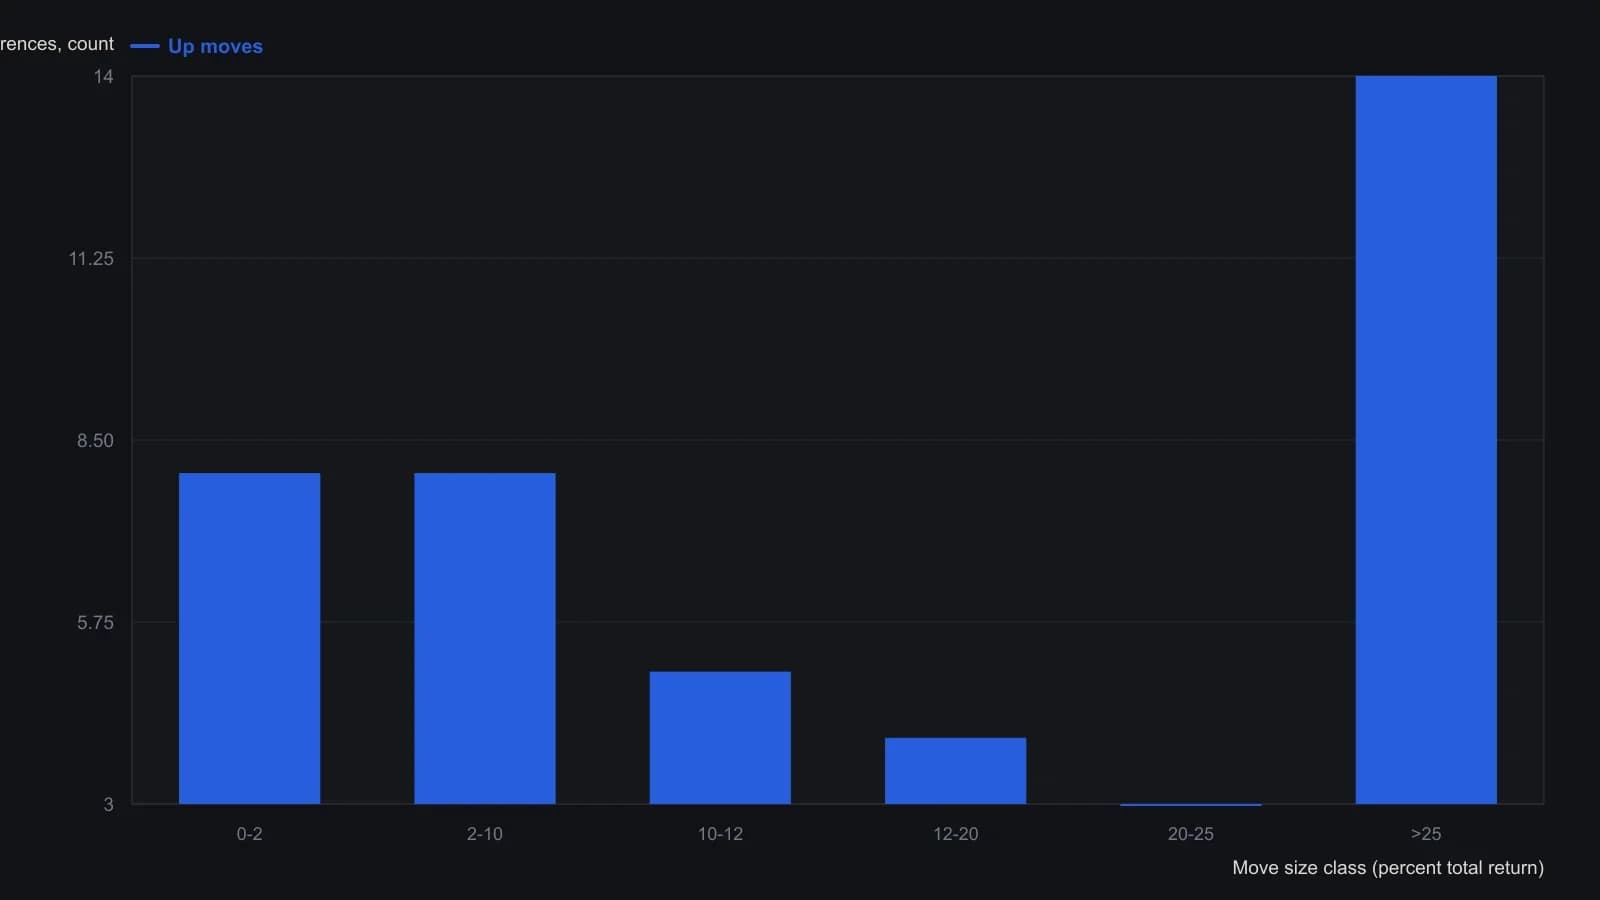
The greater-than-25-percent bin is an open tail; the source lists the fourteen constituent runs as 41.3, 40.2, 45.4, 74.4, 36.7, 28.0, 45.7, 28.9, 35.2, 25.3, 44.5, 30.3, 30.6 and 27.4 percent.
All readings on this track · 19 readings
- 1988Crash fear fails the depression regime test
- 1990October 1987 cycle overlay and the loss-trap
- 1990Constructing nested four-year market cycles
- 1991Evaluating quarterly return runs with historical analogs
- 1992Evaluating split events across correction and bear regimes
- 1993Mining-bullion relative strength as a gold-sleeve regime
- 1994A two-horizon case study of a market-breadth oscillator
- 1994Extreme short-rate declines as equity regime context
- 1997Clustered true-range days as a regime label rather than a top forecast
- 2001Nearest-neighbor one-week forecast from log-price patterns
- 2001Constructing nearest-neighbor forecasts gated by a trend filter
- 2003Regime context for debt-era bear rallies
- 2004Testing a 1987 stock and gold analog by wave degree
- 2004Shifting calendar regimes and election-cycle analogs
- 2006Aligning sugar boom phases with seasonal analogs
- 2009Crowd consensus and failed targets as regime context
- 2011Treat a long-horizon chart analog as a regime scenario
- 2012Build a weekly analog as a dated forecast object
- 2015From a drawn price shape to an event-cloud case study