1986issue C081-9
Weekly resamples as a diagnostic filter for statistical windows
A long daily industrial-average and exchange-volume record was collapsed into weekly price-volume pairs and scored with a runs-test, a chi-square-test, and an autocorrelation-test. The three cutoffs do not agree on length, and volume fails the same checks that price passes.
- Weekly price non-randomness declined through seven weeks and again after 24 weeks, while serial dependence stayed extremely high below ten weeks and lost significance after 40 weeks.
- Weekly volume chi-square-test values were extremely low beside a 95 percent reference of 14.067, so volume that fails the same tests should not set a price lookback.
- A sharp cutoff near 30 weeks, with average chi-square-test values near five through lag 100, marked a defined research-window, while serial-dependence spans ran past probable non-random windows.
- Editorial: take a research lookback from clustered pure-window and probable-window cutoffs after the weekly resample, not from a single lag.
A weekly collapse of a long daily record
Daily industrial-average closes and exchange total volume from 1897-01-02 through 1985-12-31 were collapsed into 4,623 weekly price-volume pairs, about 18.65 percent of the daily series. Those weekly pairs were then evaluated for non-randomness and serial dependence.
The weekly evaluation summarized runs-test non-randomness, chi-square-test lag profiles, and autocorrelation-test serial dependence against 95 percent and 99 percent chi-square-test reference levels.
What each test is marking
The runs-test is a non-randomness check on ordered weekly price or volume observations over a stated lag and lookback. The chi-square-test is a lag-by-lag significance summary that marks where the average or lowest statistic stays above a stated confidence cutoff. The autocorrelation-test is a serial-dependence check on the same ordered series, used to see whether dependence outlasts the non-randomness window.
A pure-window is a lookback in which no chi-square-test value falls below the chosen confidence cutoff. A probable-window is a lookback in which the average chi-square-test value remains above that cutoff. A research-window is a sampling interval kept for further study because tests cluster above a cutoff, not a recommendation to trade.
Price cutoffs do not share one length
Weekly price non-randomness declined strongly through a lag of seven weeks and declined again after 24 weeks. Weekly price serial dependence was described as extremely high below ten weeks and as losing significance after 40 weeks.
Relative to daily results, the weekly price series lengthened the pure-window and shortened the probable-window, which was read as the weekly resample filtering daily randomness. Serial-dependence windows generally extended beyond where probable non-random windows ended.
Volume fails the same checks
Weekly volume chi-square-test values were described as extremely low and insignificant beside a 95 percent reference of 14.067, consistent with a random volume process. Weekly and daily volume-change series were judged random except for a short serial-dependent volume window of 11 days on the daily series and 10.7 days on the weekly series.
Editorial: a volume series that fails the same runs-test and chi-square-test checks is not a substitute source for the research lookback assigned to price.
Weekly DJIA trading-window lengths by cutoff and confidence
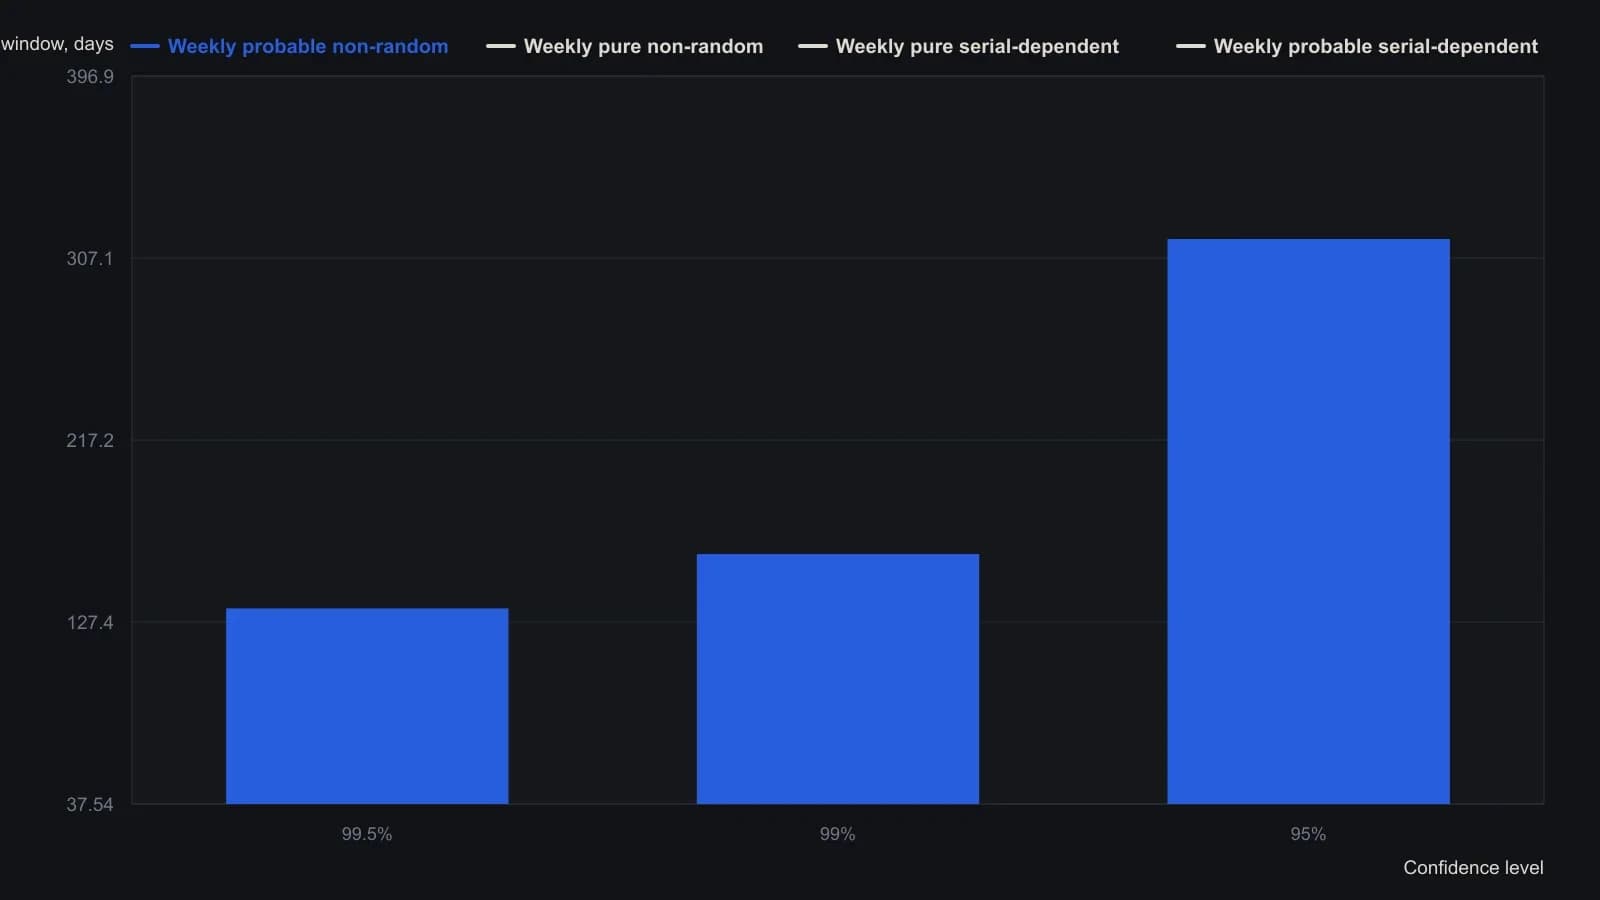
A pure window means no chi-square value fell below the stated cutoff; a probable window means only the average chi-square stayed above it. Weekly days equal whole-week lags times the source conversion 5.36334. Sample: weekly DJIA close and NYSE volume, 2 January 1897–31 December 1985 (4,623 pairs).
Where the research-window was marked
A sharp cutoff near 30 weeks in the share of tests below the 95 percent level, with average chi-square-test values approaching five and remaining near that level through lag 100, marked a defined non-random research-window.
A well-defined pure serial-dependent weekly window was reported at 187.72, 193.08, and 198.44 days across three confidence levels. A 32-day 99 percent non-random serial-dependent price window and a 167-day 99 percent serial-dependent extension appeared in both the daily and weekly cadences. The weekly serial-dependent span reached 188 to 198 days from the 99.5 percent to 95 percent levels.
Short, medium, and long zones
Short, medium, and long evaluation zones were set at up to 10 weeks, 10 to 30 weeks, and 30 to 50 weeks. The short zone's strictest 99 percent span was 32 days inside a 51-day band, with eight significant non-random windows plus all pure serial-dependent windows in the 5-to-10-week span.
Editorial: those zones show where the three tests cluster. They are not a rule for choosing a single lag, and a research-window kept from that cluster is only an interval held for further study.
All readings on this track · 15 readings
- 1986Constructing runs and persistence tests from labeled prices
- 1986Evaluating daily price and volume serial independence windows
- 1986Evaluating advance-decline plus-day runs against chance baselines
- 1986Weekly resamples as a diagnostic filter for statistical windows
- 1988Runs test as a critique of price-series memory
- 1989Evaluating weekday close direction with a counted baseline
- 1989Statistical windows for indicator time parameters
- 1992Channel-height ratios for equity trend evaluation
- 2001A runs test before volatility and expected-value sizing
- 2005Constructing runs-test z-scores for signed return persistence
- 2005Evaluating persistence with runs and autocorrelation
- 2005Weekday FX turning points and close run tests
- 2013Constructing a runs-test turn forecast
- 2017Star rating from slope and swing runs
- 2018Regime-dependent odds after directional price runs