1997issue C121-3
Clustered true-range days as a regime label rather than a top forecast
A 50-session volatility-percent count of 3% true-range days rose during ordinary declines and often stayed high into new advances, so it read more like a weeks-to-months regime label than a warning of an orderly top. Two crash analogs showed a much higher count for months before those breaks, and that comparison was presented as limited.
- Sessions with a 3% true-range day were uncommon in the long sample and arrived as clustered range expansion rather than at a regular interval.
- In most ordinary declining markets the 50-session volatility-percent count did not rise before the slide. It increased during the decline, peaked near the low, and often stayed elevated as a new advance began.
- In the 1929 and 1987 crash analogs the same count reached 20% to 30% about six months earlier and stood at 12% or higher immediately before those breaks.
- The construction was described as uninformative for anticipating an orderly decline, and on 22 September 1997 the count stood at 4, below those crash-window readings.
What the volatility-percent count records
A true-range day, in this construction, is a session whose true range is at least 3% of that session's price. The default reading counts how many such 3% true-range days occur in the prior 50 sessions, which is the lookback window, and reports that share as a percentage. That share is the volatility-percent count.
The count is only a record of how much clustered range expansion sits inside a fixed window. It does not say why prices moved, and it does not, on its own, classify the next decline as sudden or orderly.
How often 3% true-range days appeared
From 29 October 1928 through 13 July 1997, 3% true-range days occurred on fewer than 7.2% of sessions. They arrived in clusters rather than at a regular interval.
After the sample was started in July 1935 and 1 October 1987 through 29 February 1988 was dropped, the same 3% threshold appeared on only 2.9% of sessions and mostly during declining markets.
The count rose during ordinary declines
In most ordinary declining markets in the sample, the count did not rise before the slide. It increased during the decline and peaked near the low. That path matches an orderly decline: a downward phase in which the volatility-percent count rose mainly after prices had already begun to fall.
New advances often began while the count was still high, because the prior decline's final expansion left the lookback window elevated.
Crash analogs stayed elevated for months
A crash analog, here, is a historical episode in which the count stayed elevated for months before a sudden break. In the 1929 and 1987 crash analogs, the 50-session count reached 20% to 30% about six months earlier and stood at 12% or higher immediately before those breaks.
The crash comparison rested on two historical episodes and was presented as limited rather than statistically conclusive.
The 1997 reading sat below the crash analogs
On 22 September 1997 the same 50-session count stood at 4, below the crash-window readings used as analogs. The count was described as uninformative for anticipating an orderly, non-crash decline.
DJIA 50-session share of 3% true-range days, summer 1997
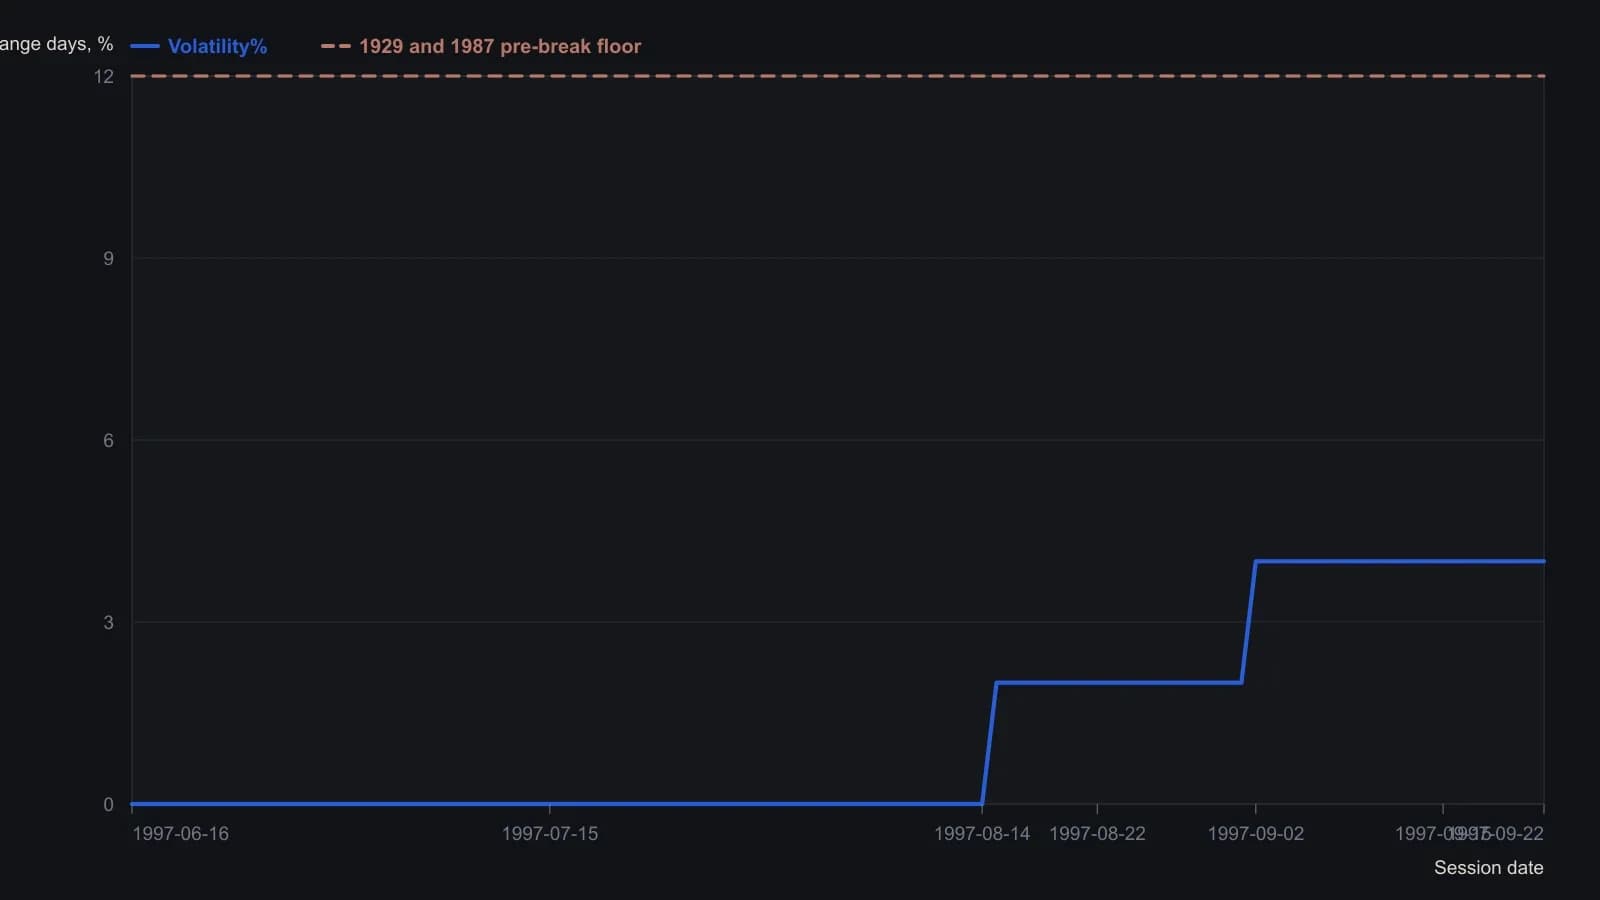
The source fixed VolLevel at 3% of price and LookBack at 50 sessions. It treated the two crash analogs as a limited comparison, not a statistical sample, and said the same count does not warn of an orderly bear market. The 27 March 1997 true-range day had already left the 50-session window before the span shown.
All readings on this track · 19 readings
- 1988Crash fear fails the depression regime test
- 1990October 1987 cycle overlay and the loss-trap
- 1990Constructing nested four-year market cycles
- 1991Evaluating quarterly return runs with historical analogs
- 1992Evaluating split events across correction and bear regimes
- 1993Mining-bullion relative strength as a gold-sleeve regime
- 1994A two-horizon case study of a market-breadth oscillator
- 1994Extreme short-rate declines as equity regime context
- 1997Clustered true-range days as a regime label rather than a top forecast
- 2001Nearest-neighbor one-week forecast from log-price patterns
- 2001Constructing nearest-neighbor forecasts gated by a trend filter
- 2003Regime context for debt-era bear rallies
- 2004Testing a 1987 stock and gold analog by wave degree
- 2004Shifting calendar regimes and election-cycle analogs
- 2006Aligning sugar boom phases with seasonal analogs
- 2009Crowd consensus and failed targets as regime context
- 2011Treat a long-horizon chart analog as a regime scenario
- 2012Build a weekly analog as a dated forecast object
- 2015From a drawn price shape to an event-cloud case study