1994issue C061-16
A two-horizon case study of a market-breadth oscillator
Daily advance-decline votes were converted into a short-horizon oscillator and then accumulated into a summation total, so a historical analog overlay and a long-term price channel could test an intermediate-term hypothesis.
- Daily net advances versus declines were chosen because they correlated with a market index that could be traded and because the cumulative advance-decline line separates upside from downside participation.
- The oscillator is the gap between two exponential averages of the daily advance-decline difference, not a smooth of the cumulative line; the summation index is a running total of those oscillator values.
- Two summation-index paths were overlaid, and price was also located inside a long-standing channel, so the intermediate-term reading could be echoed or refuted.
- Editorial takeaway: treat the oscillator as the short-horizon bench and the summation index as the accumulated series that analog overlays and price channels can falsify.
Editorial frame
This article is a TradersWeek editorial reading of a historical workflow. Treat market-breadth oscillators as a two-horizon laboratory. First convert daily advance-decline votes into a short-horizon difference of exponential trends. Then accumulate that difference so analog overlays and long-term price channels can falsify an intermediate-term hypothesis.
Why the raw series was daily net advances
Daily net advances versus declines were selected as the raw breadth series because they correlated with a market index that could be traded and because the cumulative advance-decline line separates upside from downside participation.
When common-stock and all-stock tapes diverge
The same NYSE advance-decline tape was split into a common-stock series and an all-stock series. After policy-rate cuts began in 1991, common stocks lagged interest-rate-sensitive names, so the two series no longer overlaid as they typically did when rates were stable.
Three exponential smooths on the cumulative line
The cumulative advance-decline line was smoothed with 10 percent, 5 percent, and 1 percent exponential trends. Those smooths were described as behaving like roughly 19-day, 39-or-40-day, and 200-day averages. A daily line holding above a rising 1 percent trend was treated as an intermediate-upside condition. A break below that trend was treated as a risk of serious erosion.
The oscillator is a gap in the daily difference
The oscillator is not applied to the cumulative line. It is the gap between a 10 percent and a 5 percent exponential average of the daily advance-decline difference. Single-average smooths were tried first and failed to capture the forces acting on the tape.
A bounded reading and a later volatility shift
Through 1992 and 1993 the oscillator mostly stayed between minus 100 and plus 80, a band that was read as low volatility. A drop to minus 129 in November 1993 was read as a shift toward thinner liquidity and higher volatility.
The summation index as accumulated area
The summation index is a running total of oscillator values. It was motivated as a measure of the areas above and below zero. Directional turns in that running total were aligned with intermediate market turning points. A reading that stayed above zero was treated as confirmation of an upward trend.
A hand-calculated sample
Daily advance-decline data from 1962 through 1970 were calculated by hand so a 1970 write-up would cover two full bear-bull cycles before personal computers were available.
An analog overlay of two summation paths
An overlay of summation-index paths from 1959-62 and 1991-94 showed major turning points in partial alignment. Minor tops and bottoms inverted or drifted out of phase. A late re-phasing, if the analog held, pointed toward a June low. The comparison chart ran through 22 March 1994.
The analog interval being tested included a Dow decline from the 720s to below 550, described as close to a 27 percent peak-to-trough drop. That path was used only as a template that later prices either echo or refute.
A long-term price channel as a second check
On a logarithmic Dow chart spanning 1928-94, a channel drawn since the 1920s had contained prices for 61 years. As of the 1994 discussion the average sat near the upper boundary above the median, in a location compared with 1962, after a recent test of the upper limit failed to break out.
Editorially, the analog overlay and the long-term price channel are not extra decorations. They are the checks that can falsify the intermediate-term reading taken from the summation index.
McClellan A-D summation after +3000 tops
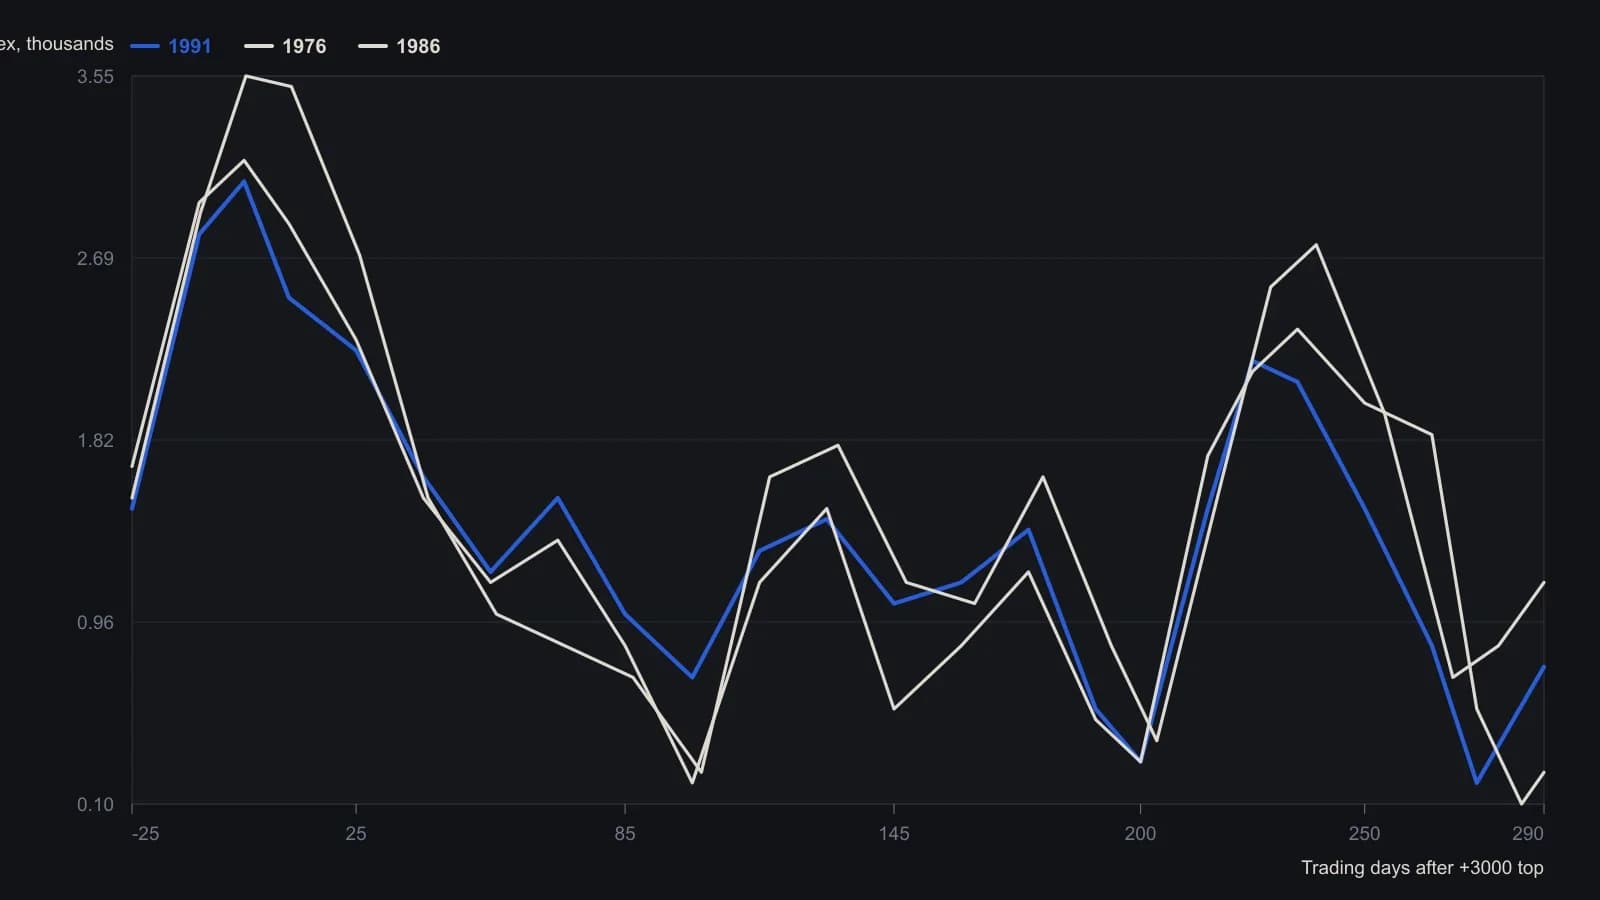
The source aligned each episode at the day the summation first topped above +3000. Digitized points are approximate; the raster does not support finer than about 0.1 thousand.
All readings on this track · 19 readings
- 1988Crash fear fails the depression regime test
- 1990October 1987 cycle overlay and the loss-trap
- 1990Constructing nested four-year market cycles
- 1991Evaluating quarterly return runs with historical analogs
- 1992Evaluating split events across correction and bear regimes
- 1993Mining-bullion relative strength as a gold-sleeve regime
- 1994A two-horizon case study of a market-breadth oscillator
- 1994Extreme short-rate declines as equity regime context
- 1997Clustered true-range days as a regime label rather than a top forecast
- 2001Nearest-neighbor one-week forecast from log-price patterns
- 2001Constructing nearest-neighbor forecasts gated by a trend filter
- 2003Regime context for debt-era bear rallies
- 2004Testing a 1987 stock and gold analog by wave degree
- 2004Shifting calendar regimes and election-cycle analogs
- 2006Aligning sugar boom phases with seasonal analogs
- 2009Crowd consensus and failed targets as regime context
- 2011Treat a long-horizon chart analog as a regime scenario
- 2012Build a weekly analog as a dated forecast object
- 2015From a drawn price shape to an event-cloud case study