2003issue C111-6
Regime context for debt-era bear rallies
Editorial framing of a 2003 case study: treat a multi-week index bounce as a market-regime test before it becomes a trade. Classify the rally against prior post-peak sequences, bound exposure with a debt-and-housing unwind path, and only then compare the then-current tape with dated historical analogs.
- Holds of weeks or longer shifted weight toward major trends, market-health readings, and fundamentals, so a multi-week bounce was classified as a market-regime question before it was treated as a trade.
- A major US industrial average showed eight rallies after the 2000 peak; through the seventh rally in 2002, average peak-to-next-low retracement was 120%, leaving the market 20% lower after each bounce faded.
- A scenario-filter chained weak earnings, foreign capital withdrawal, higher bond yields and mortgage rates, a stalled housing market, and forced equity sales to bound exposure before entry.
- A historical-analog then compared rally count, retracement, and debt-to-gdp with Japan after 1989 and with 1929, after US credit-market debt exceeded 300% of output by 2003 Q1.
Holding period changes the context
Holds measured in hours treated the primary trend and most economic conditions as secondary. Holds of weeks or longer shifted weight toward major trends, market-health readings, and fundamentals.
Editorial: for a hold measured in weeks, a bounce is first a market-regime test. That reading asks whether price action is a new advance or another bounce inside a larger risk-off tape.
Post-peak rallies as a regime test
A major US industrial average showed eight rallies after the 2000 peak and twelve rallies from 1998. A thrust-oscillator, a breadth-and-volume ratio in the Arms-indicator family, flashed negative divergence on nine of those twelve moves and on four of the eight post-2000 rallies.
Another thrust-oscillator warning appeared in mid-July 2003 beside a mcclellan-summation signal and a daily large-cap double top. The mcclellan-summation is a cumulative breadth oscillator used with price structure to flag a possible top.
Between the 2000 peak and the seventh rally in 2002, average peak-to-next-low retracement was 120%, leaving the market 20% lower after each bounce faded. Those fades fit a bear-rally: an advance after a major peak that later gives back enough ground to leave the market lower than before the bounce.
SPY bear-rally retracements after the 2000 peak
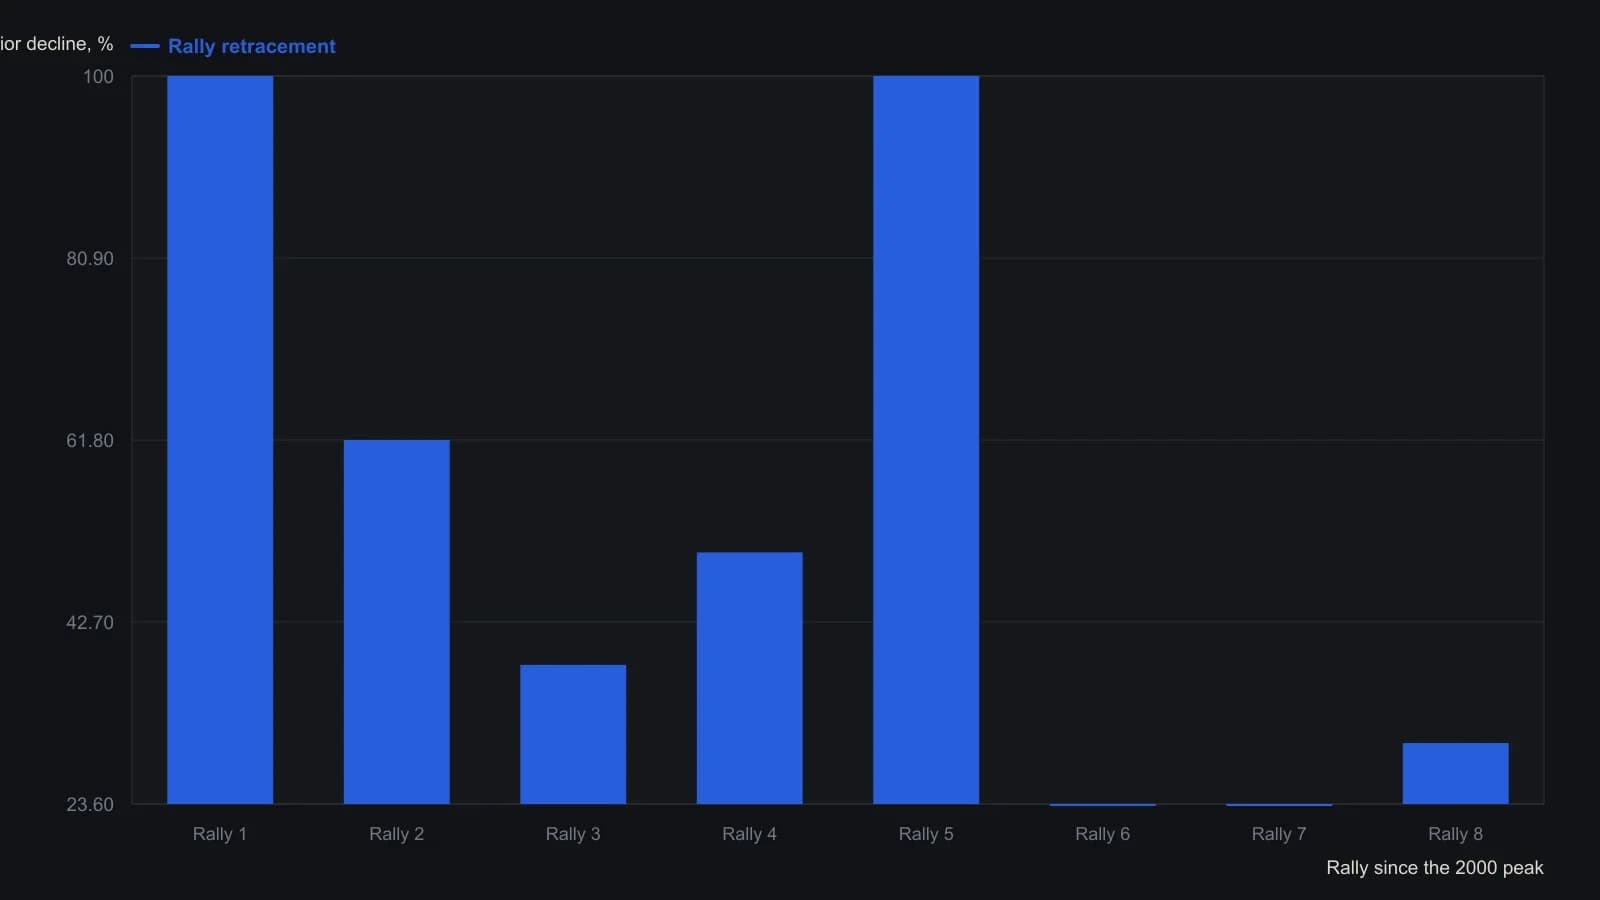
The source marked each rally with a tilde, so these are the printed Fibonacci labels rather than tick-level measurements.
Bounding exposure with a scenario-filter
A worked scenario chained weak earnings and falling stocks to foreign capital withdrawal, higher bond yields and mortgage rates, a stalled housing market, and forced equity sales. That chain is a scenario-filter: a pre-trade sequence of equity, rate, housing, and forced-sale steps used to bound exposure before entry.
The same debt-overload pattern was mapped to 1929, Japan in 1989-90, and a 1981-82 North American shock when mortgage rates moved from about 12% to 22% in roughly six months.
Unlike earlier recessions, private debt in real terms kept rising through the early-2000s downturn alongside budget and current-account gaps. The 1982-2000 advance, the longest bull stretch cited, was followed by an unusually mild output recession while valuations stayed historically high. Trailing large-cap price/earnings still stood far above a 1920-2003 median of 15.2.
US total credit-market debt exceeded 300% of GDP by 2003 Q1, with about 32.281 trillion dollars of debt against about 10.704 trillion of output and a later reading near 302%. That debt-to-gdp figure sat above about 265% in 1929 and about 250% in Japan around 1989.
Cross-market snapshots included US household equity holdings at 175% of income in 2000 versus 90% in Japan in 1989, foreign ownership of government securities near 40% versus 10%, and US household debt rising from 85% of income in 1992 to 103% in 1999 and above 111% by June 2003.
Historical-analog comparison after the filter
A Japanese large-cap average peaked at 38957 on 29 December 1989, logged at least ten sizable bear rallies over thirteen years, and printed 7608 on 28 April 2003. Three 1992-2000 rallies averaged more than 50% from prior lows, one exceeded 60%, and both the index and urban land later stood more than 80% below early-1990s highs.
A historical-analog compared rally count, retracement depth, and debt ratios against those earlier overload episodes. Editorial: that comparison came after the bounce was classified and after the scenario-filter had bounded exposure.
Three mutually exclusive macro paths, uncontrolled inflation, a fragile status quo, and a deflationary debt unwind, were treated as requiring different portfolio and trading regimes rather than one all-weather stance.
All readings on this track · 19 readings
- 1988Crash fear fails the depression regime test
- 1990October 1987 cycle overlay and the loss-trap
- 1990Constructing nested four-year market cycles
- 1991Evaluating quarterly return runs with historical analogs
- 1992Evaluating split events across correction and bear regimes
- 1993Mining-bullion relative strength as a gold-sleeve regime
- 1994A two-horizon case study of a market-breadth oscillator
- 1994Extreme short-rate declines as equity regime context
- 1997Clustered true-range days as a regime label rather than a top forecast
- 2001Nearest-neighbor one-week forecast from log-price patterns
- 2001Constructing nearest-neighbor forecasts gated by a trend filter
- 2003Regime context for debt-era bear rallies
- 2004Testing a 1987 stock and gold analog by wave degree
- 2004Shifting calendar regimes and election-cycle analogs
- 2006Aligning sugar boom phases with seasonal analogs
- 2009Crowd consensus and failed targets as regime context
- 2011Treat a long-horizon chart analog as a regime scenario
- 2012Build a weekly analog as a dated forecast object
- 2015From a drawn price shape to an event-cloud case study