2004issue C031-4
Testing a 1987 stock and gold analog by wave degree
A paired-analog of the 1987 stock and gold advance counts each market on its own Elliott-wave ladder, labels the shared rise as a secular-trend or only a cyclical-rally, and pre-states the trendline-break or failed recovery that would falsify the template.
- Count each market on its own wave ladder before treating a shared advance as one analog.
- Label whether the rise is a secular-trend or only a cyclical-rally inside the opposite regime.
- Pre-state the trendline-break or failed recovery that would falsify the 1987 template.
- A later role-swap can invert which market is the secular bull and should stay an open analog until the post-peak sequence is known.
A paired-analog as a wave-degree test
In 1987 a major industrial stock average and gold advanced together, and gold's peak arrived about two months after the stock-market peak. From 1985 through 1987 both markets were described as rising strongly in 1985, consolidating while still advancing in 1986, and accelerating in 1987.
Editorial reading: a paired-analog is a same-window comparison of two markets that asks whether their wave degrees and post-peak sequences match. Count each asset on its own Elliott-wave ladder before treating the shared advance as one analog.
Wave degree on each ladder
Gold's post-1980 drop was counted as a five-wave-count from a January 1980 high of 873 through intervening swings to a February 1985 low of 283, a collapse of more than 67 percent. The 283 gold low remained intact for more than ten years and was not undercut until 1998.
The 1985-1987 gold rise was framed as a cyclical-rally inside a secular-trend bear that began after 1980. The 1987 industrial-average rise was framed as a cyclical bull inside a secular-trend bull.
Editorial reading: those labels are the wave-degree test. The same calendar window can hold a cyclical-rally in one market and a cyclical advance inside a secular-trend bull in the other.
COMEX gold weekly, 1985–1989
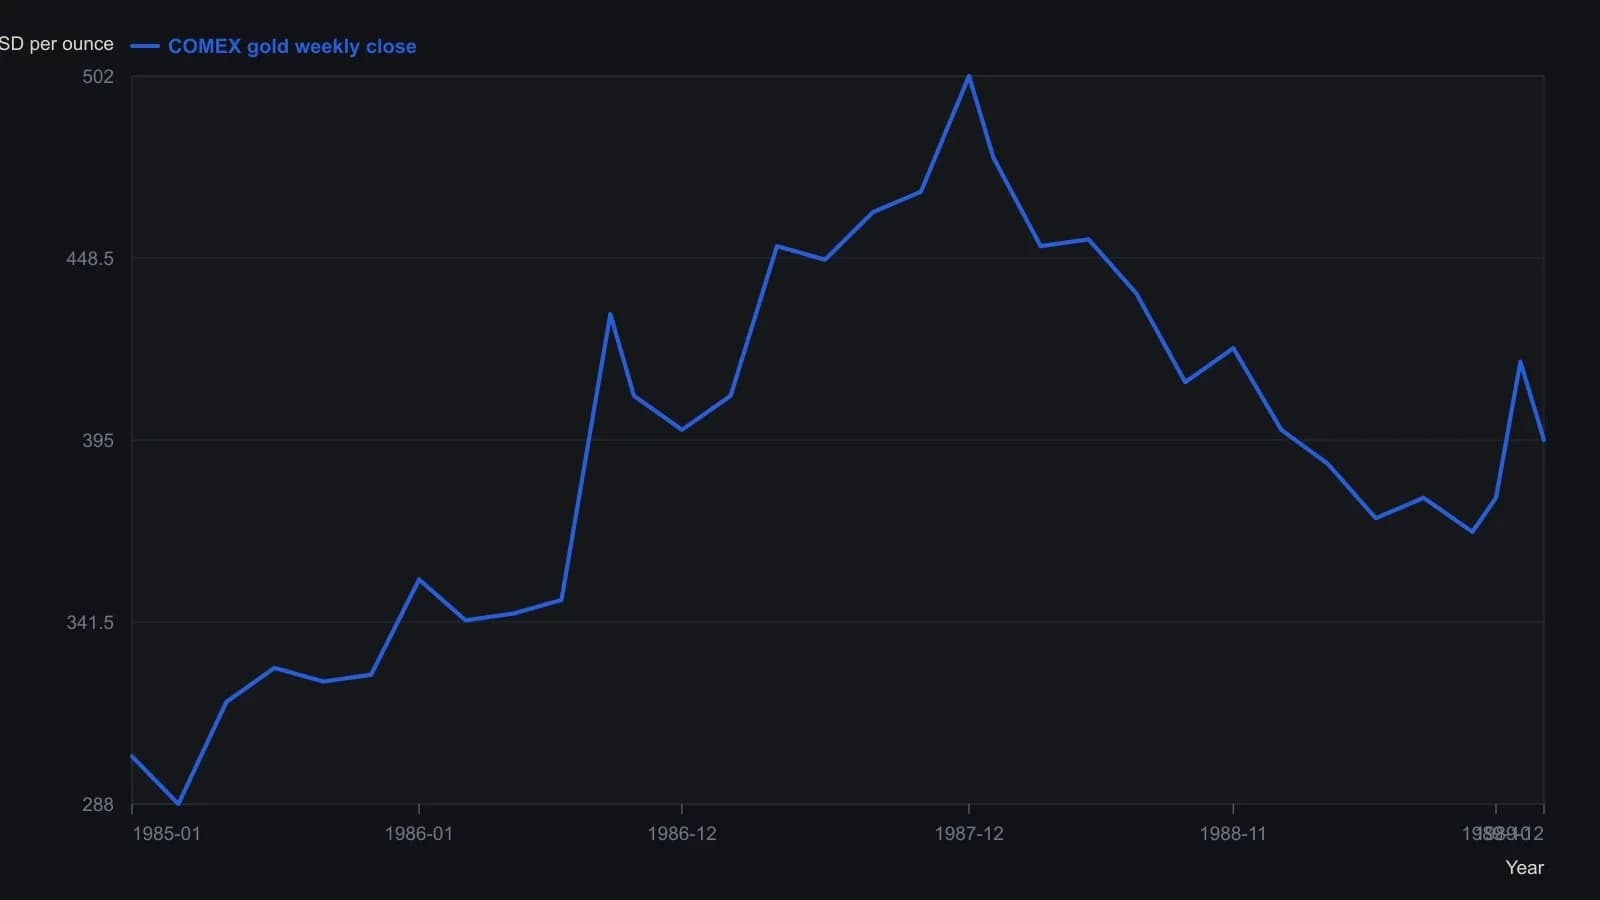
Closes approximated from weekly bars on a linear price scale; sampled about monthly so the series stays under 60 points. Intra-week extremes are not reconstructed.
What followed each peak
After the October 1987 break, the industrial average recorded a new high in autumn 1989 and by 1991 no longer traded below its 1987 peak. A broader geometric stock average did not reclaim its 1987 high until spring 1994.
Gold's 1987 high occurred in December just under 510. By the time the industrial average had recovered its 1987 high, gold had fallen below 375, a decline described as about 26 percent.
Editorial reading: the post-peak sequences did not match. Stocks reclaimed the 1987 high. Gold did not. A paired-analog that ignores that split treats the window as more similar than the archive sequence was.
Trendline-break as a timing marker
An uptrend line from the 1985 industrial-average low broke in mid-October, about two months after the price peak. Gold's line from the 1986 low broke in the second half of January 1988, about one month after its peak.
Editorial reading: treat the trendline-break as a post-peak timing marker. Pre-state which line, from which swing low, must break, and what failed recovery would falsify the 1987 template.
A role-swap left the later analog open
The 2003 comparison inverted those roles. Stocks were treated as having shifted into a secular-trend bear and gold into a secular-trend bull, so a simultaneous 2003 advance was left as an open analog rather than a settled forecast.
Editorial reading: that inversion is a role-swap. It changes which market carries the secular-trend bull identity, so the later window stays a hypothesis until a comparable post-peak sequence is observed.
All readings on this track · 19 readings
- 1988Crash fear fails the depression regime test
- 1990October 1987 cycle overlay and the loss-trap
- 1990Constructing nested four-year market cycles
- 1991Evaluating quarterly return runs with historical analogs
- 1992Evaluating split events across correction and bear regimes
- 1993Mining-bullion relative strength as a gold-sleeve regime
- 1994A two-horizon case study of a market-breadth oscillator
- 1994Extreme short-rate declines as equity regime context
- 1997Clustered true-range days as a regime label rather than a top forecast
- 2001Nearest-neighbor one-week forecast from log-price patterns
- 2001Constructing nearest-neighbor forecasts gated by a trend filter
- 2003Regime context for debt-era bear rallies
- 2004Testing a 1987 stock and gold analog by wave degree
- 2004Shifting calendar regimes and election-cycle analogs
- 2006Aligning sugar boom phases with seasonal analogs
- 2009Crowd consensus and failed targets as regime context
- 2011Treat a long-horizon chart analog as a regime scenario
- 2012Build a weekly analog as a dated forecast object
- 2015From a drawn price shape to an event-cloud case study