2001issue C111-5
Nearest-neighbor one-week forecast from log-price patterns
A four-lag pattern in weekly log-changes can be ranked by absolute distance so the later paths of the closest historical analogs become a one-week outlook.
- A nearest-neighbor forecast can be assembled from ordered weekly closes by defining a four-point pattern, ranking past weeks by similarity, and reading the later path of the closest matches.
- The pattern uses weekly differences of the natural log of the close at lags of one, two, four, and five weeks, and similarity is the sum of absolute differences on those four moves.
- A one-week outlook can be the average of the four subsequent weekly log-changes that followed the nearest historical matches.
- Averaging several neighbors, and optionally giving closer analogs more normalized weight, is presented as a way to keep one noisy lag from dominating the pattern.
A four-point analog from weekly closes
A nearest-neighbor forecast can be assembled from ordered weekly closes by defining a four-point pattern, ranking past weeks by similarity, and reading the subsequent path of the closest matches.
The reconstructed pattern uses weekly differences of the natural log of the close at lags of one, two, four, and five weeks.
How similarity becomes a one-week outlook
Similarity is the sum of absolute differences between those four log-moves and the same four moves on the current reference week.
A one-week outlook can be taken as the average of the four subsequent weekly log-changes that followed the nearest historical matches.
Weekly S&P 500 closes in the analog window
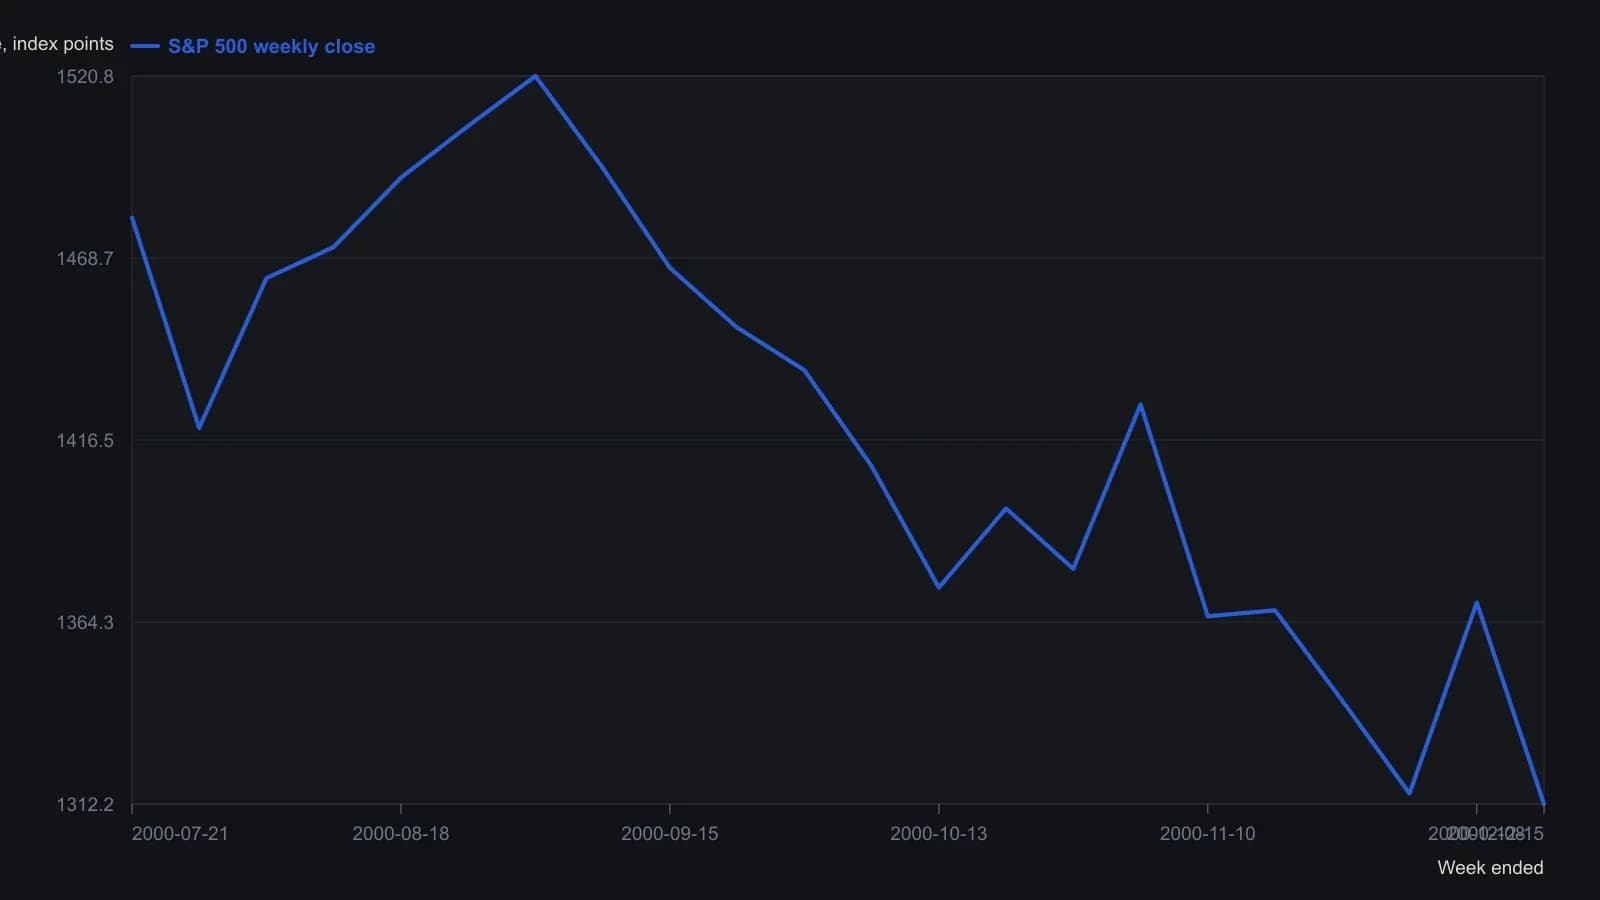
The sheet is stored newest-first; the series here is chronological. Only the last 22 weekly rows are visible. The full worksheet in the article runs from 5 January 1980 to 15 December 2000.
Global screens and local lags
Independence and conditional-entropy checks can hint at how much memory a series holds, but they remain global screens. Pattern lags may still need trial-and-error for a local predictor.
Neighbor pool and weighting
Because only older observations than the reference week can serve as analogs, a longer backtest shrinks the usable neighbor pool as the reference date moves backward.
Averaging several neighbors and using absolute distance rather than a single closest match is presented as a way to keep one noisy lag from dominating the pattern.
Closer analogs can be given more weight than distant ones if the weights are normalized, instead of treating the four nearest matches as equal.
All readings on this track · 19 readings
- 1988Crash fear fails the depression regime test
- 1990October 1987 cycle overlay and the loss-trap
- 1990Constructing nested four-year market cycles
- 1991Evaluating quarterly return runs with historical analogs
- 1992Evaluating split events across correction and bear regimes
- 1993Mining-bullion relative strength as a gold-sleeve regime
- 1994A two-horizon case study of a market-breadth oscillator
- 1994Extreme short-rate declines as equity regime context
- 1997Clustered true-range days as a regime label rather than a top forecast
- 2001Nearest-neighbor one-week forecast from log-price patterns
- 2001Constructing nearest-neighbor forecasts gated by a trend filter
- 2003Regime context for debt-era bear rallies
- 2004Testing a 1987 stock and gold analog by wave degree
- 2004Shifting calendar regimes and election-cycle analogs
- 2006Aligning sugar boom phases with seasonal analogs
- 2009Crowd consensus and failed targets as regime context
- 2011Treat a long-horizon chart analog as a regime scenario
- 2012Build a weekly analog as a dated forecast object
- 2015From a drawn price shape to an event-cloud case study