2012issue C0261-71
Build a weekly analog as a dated forecast object
A weekly Historical analog comparison becomes a dated forecast after the delay is recorded and the overlay is locked at the correlation-function maximum. Keep an eight-period MACD on that same analog clock so a turning-point reading can be refreshed instead of redrawn by eye.
- Treat only the broad later path as informative, and let shorter events arrive earlier or later without rewriting the template.
- Record timing mismatch as a delay in weeks rather than as a change to the forecasting formula.
- Lock projected and observed weekly prices at the maximum of their correlation function, not by matching short-term swings.
- Apply the same analog construction to an eight-period MACD panel, and treat lag annotations as part of the forecast object.
What the construction records
Historical analog comparison on the weekly series records delay, locks the overlay of projected and observed prices at a correlation peak, and applies the same construction to a companion eight-period MACD. Chart annotations keep that analog clock on the weekly series as part of the constructed output.
Treat only the broad later path as the template
The analog construction treats only the broad later path as informative. Shorter events may arrive earlier or later without rewriting the template.
Record mismatch as a delay in weeks
Timing mismatch is recorded as a delay in weeks rather than as a change to the forecasting formula. One dated review cites 22 weeks. An earlier 2008 episode is given as 35 weeks.
Identify the present date on the analog
Before the analog can be read as a current scenario, the forecast point that corresponds to the present date must be identified.
Lock the overlay at the correlation peak
The analog is described as reproducing fine structure poorly. The overlay of projected and observed weekly prices is therefore locked at the maximum of their correlation function rather than by matching short-term swings.
DIA weekly analog locked at the November 2011 correlation peak
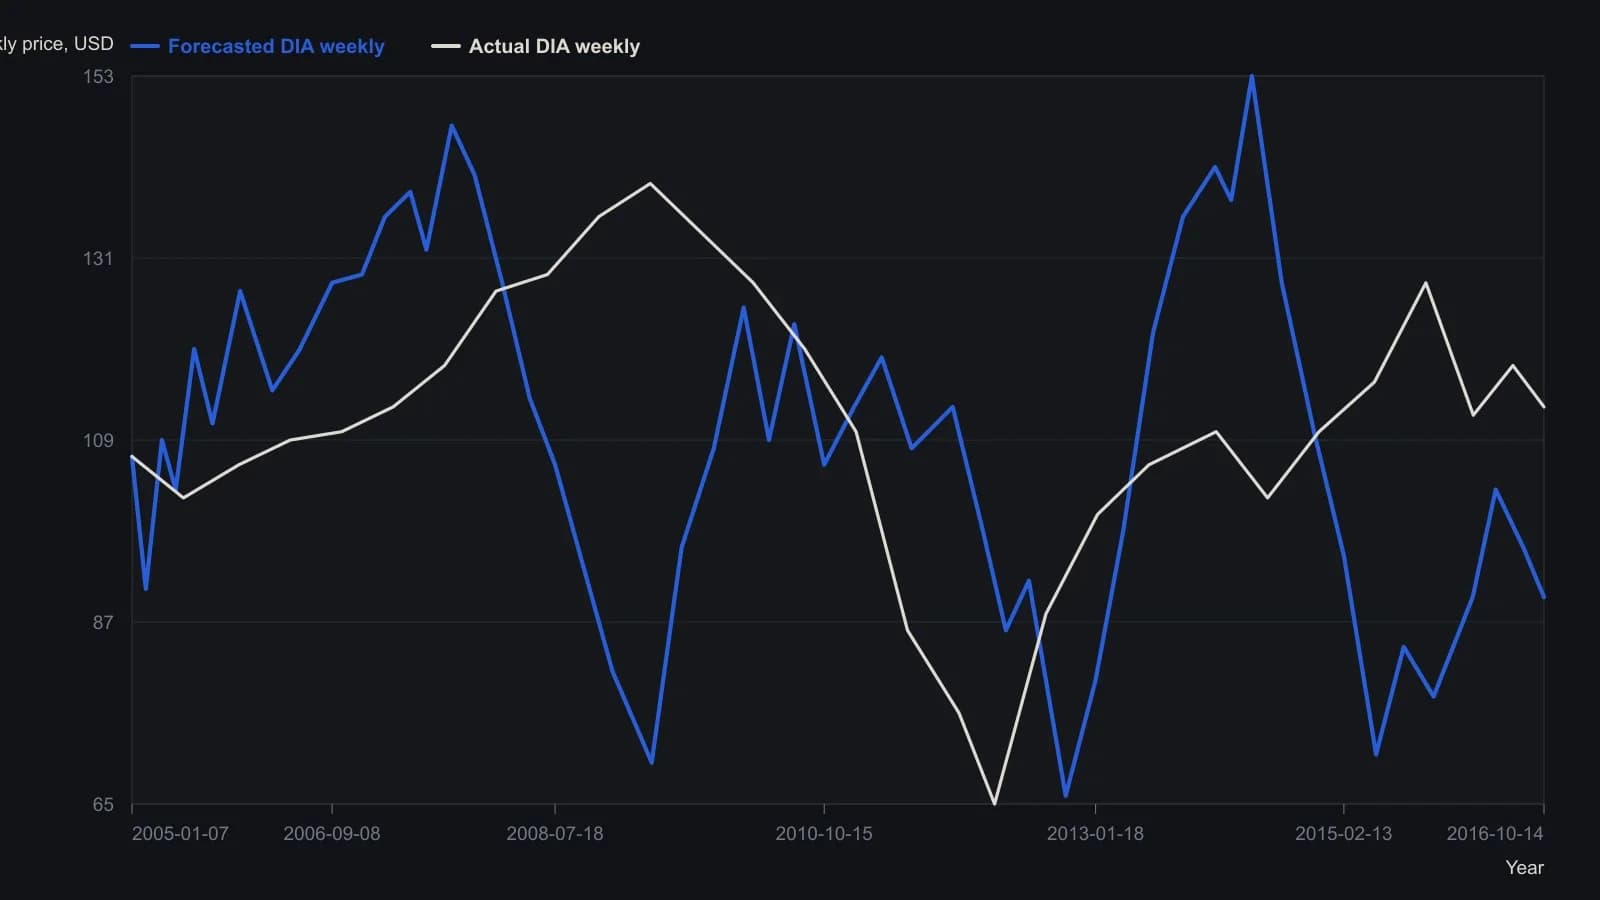
Position is taken from the correlation-function maximum, not by matching swings by eye. Timing mismatch of 22 weeks as of April 2011, and 35 weeks in 2008, is recorded as delay rather than analog failure.
Refreshing the analog can move a turning point
Separate alignments dated April 2011 and November 2011 each place the projected weekly industrial-average path against the realized path at that correlation-function maximum.
After the November 2011 realignment, the projected price minimum is timed to mid-autumn rather than August 2012. Refreshing the analog can move a dated turning-point reading.
Keep MACD on the analog clock
The same analog construction is applied to a companion indicator panel that includes an eight-period MACD, so the forecast object is not price-only.
Chart annotations on the weekly series record both lag, including a 22-week delay and a 6-week delay, and an 18-week outrunning interval. The analog clock is part of the constructed output.
All readings on this track · 19 readings
- 1988Crash fear fails the depression regime test
- 1990October 1987 cycle overlay and the loss-trap
- 1990Constructing nested four-year market cycles
- 1991Evaluating quarterly return runs with historical analogs
- 1992Evaluating split events across correction and bear regimes
- 1993Mining-bullion relative strength as a gold-sleeve regime
- 1994A two-horizon case study of a market-breadth oscillator
- 1994Extreme short-rate declines as equity regime context
- 1997Clustered true-range days as a regime label rather than a top forecast
- 2001Nearest-neighbor one-week forecast from log-price patterns
- 2001Constructing nearest-neighbor forecasts gated by a trend filter
- 2003Regime context for debt-era bear rallies
- 2004Testing a 1987 stock and gold analog by wave degree
- 2004Shifting calendar regimes and election-cycle analogs
- 2006Aligning sugar boom phases with seasonal analogs
- 2009Crowd consensus and failed targets as regime context
- 2011Treat a long-horizon chart analog as a regime scenario
- 2012Build a weekly analog as a dated forecast object
- 2015From a drawn price shape to an event-cloud case study