1986issue C061-6
Constructing runs and persistence tests from labeled prices
This construction labels an ordered series, counts each run as a streak of identical labels, and then asks separate questions about the number of runs, their run-lengths, and day-to-day persistence. Worked two-state and three-state samples compare those counts with a chance-band.
- In this construction a run is a streak of one or more identical labels after category-encoding, whether those labels are directional signs or histogram-bin codes.
- A runs-test compares the count of streaks with a chance benchmark through a standard-normal statistic and treats the chance-band from -1.96 to 1.96 as compatible with a chance arrangement of labels.
- After the count of runs is assessed, expected increase-run lengths and a besson-persistence-coefficient ask different questions about streak length and whether an event tends to follow itself.
- Category boundaries are arbitrary construction choices that must then be applied without later switching.
Start with labels, then count streaks
A runs-test is a procedure that labels an ordered series, counts streaks of identical labels, and compares that count with a chance benchmark through a standard-normal statistic. In this construction a run is a streak of one or more identical labels in an ordered series, whether those labels are directional signs or histogram-bin codes.
The same ordered series can later support a run-length comparison and a besson-persistence-coefficient. That coefficient is a persistence measure built from the unconditional probability of an event and the probability that the same event follows itself.
Category-encoding comes first
One labeling rule compares successive prices and marks each step as an increase or a decrease. Another converts successive differences, splits a histogram from a longer parent series into thirds, and codes each difference as 1, 2, or 3.
Category-encoding is the rule that turns prices or successive differences into a fixed set of discrete labels before any streak is counted. Category boundaries are described as arbitrary construction choices that must then be applied without later switching.
A two-state illustration
The worked two-state illustration uses 63 changes and 35 runs and reports a standard-normal statistic of -2.38. The same construction treats that reading as outside the chance-band from -1.96 to 1.96.
Using the scarcer of the two signs, 28 of 63, a separate statistic of 1.08 falls inside that chance-band, so the construction does not treat the sample as dominated by one direction.
A three-state illustration
The three-state illustration uses 63 differences, 33 runs, and category counts of 9, 44, and 10. It reports a statistic of 0.266, inside the same chance-band from -1.96 to 1.96.
Soybean meal price-change terciles, April–June 1980
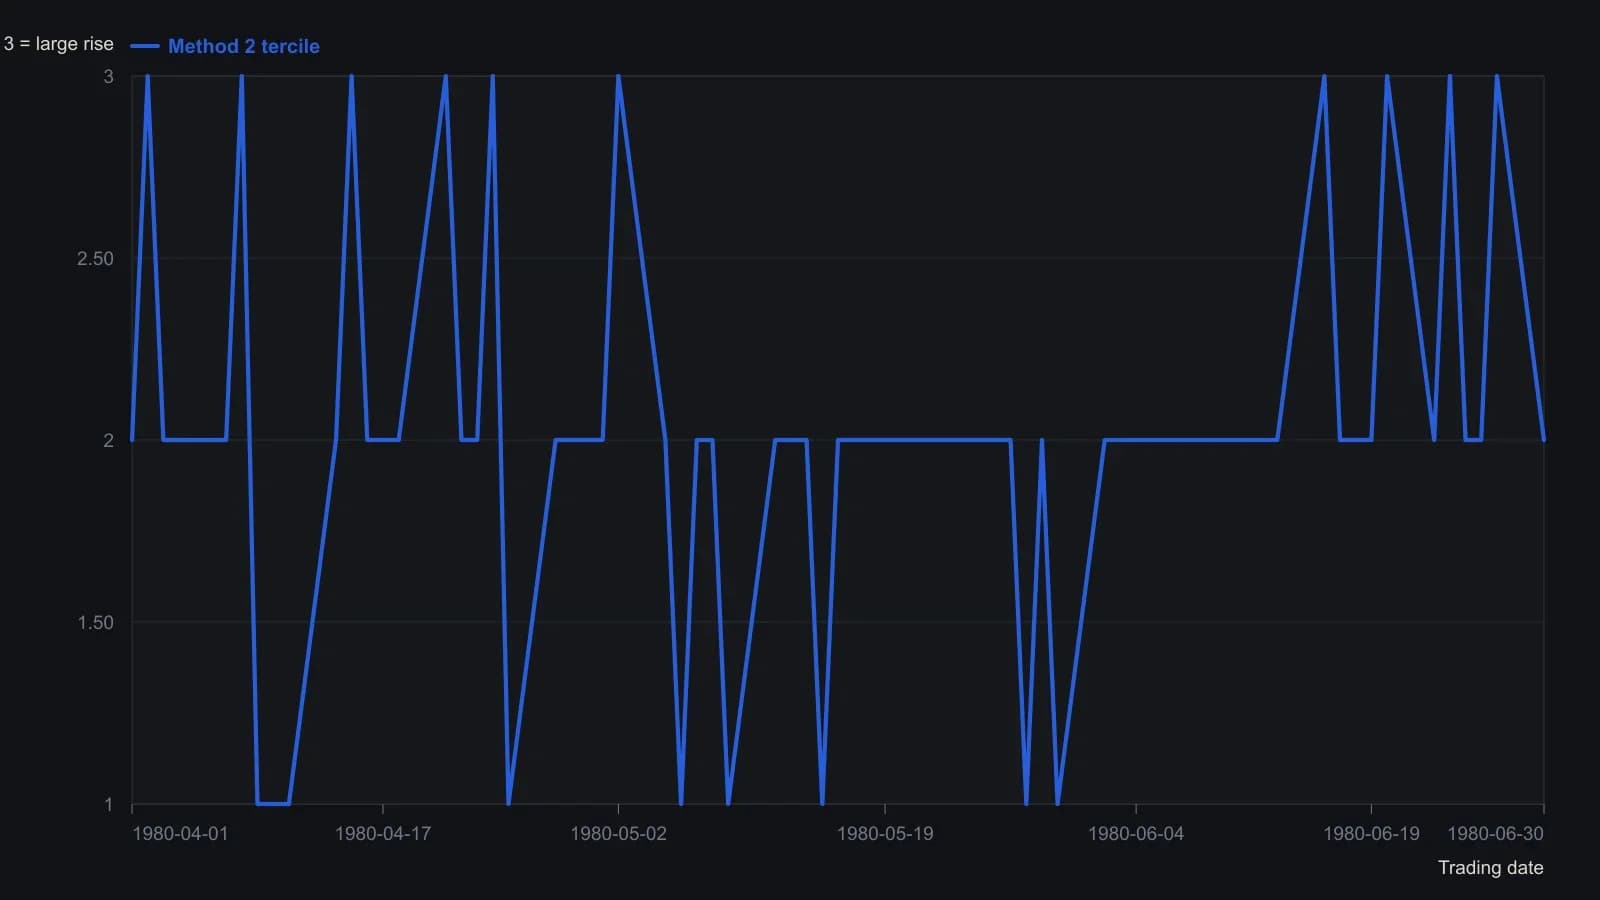
The tercile cuts come from a histogram of the longer 1 Apr 1980–30 Apr 1981 close-to-close series, not from this April–June excerpt alone.
What the chance-band is taken to mean
The chance-band is the interval from -1.96 to 1.96 for the standard-normal statistic, treated as compatible with a chance arrangement of labels. A statistic outside that interval is interpreted as evidence against a chance arrangement.
The text notes disagreement over whether the procedure tests randomness or independence and treats those ideas as not interchangeable.
Run-length after the count of runs
After the count of runs is assessed, expected frequencies of increase-run lengths are formed from N, p = 0.5556, and q = 0.4444. A run-length is how many identical labels sit in one streak, later compared with an expected frequency.
Increase-runs of length 1, 2, and 3 appear less often than those expected counts, while longer lengths are close to expected.
Besson's persistence coefficient
Besson's persistence coefficient is computed as (1 - p) / (1 - the lagged-increase probability) - 1. With p = 0.5556 and a lagged probability of 0.2698 the worked value is -0.3914.
Approximate persistence-ratio-limits for a persistence ratio of 1 ± 1.96 times the square root of pq / N are 0.8773 to 1.1227. Those bounds sit around one, formed from the event probability and the sample size, and are used to judge whether a persistence reading could arise by chance. A reading inside those limits is treated as compatible with chance, and a negative coefficient is interpreted as oscillation rather than day-to-day persistence.
All readings on this track · 15 readings
- 1986Constructing runs and persistence tests from labeled prices
- 1986Evaluating daily price and volume serial independence windows
- 1986Evaluating advance-decline plus-day runs against chance baselines
- 1986Weekly resamples as a diagnostic filter for statistical windows
- 1988Runs test as a critique of price-series memory
- 1989Evaluating weekday close direction with a counted baseline
- 1989Statistical windows for indicator time parameters
- 1992Channel-height ratios for equity trend evaluation
- 2001A runs test before volatility and expected-value sizing
- 2005Constructing runs-test z-scores for signed return persistence
- 2005Evaluating persistence with runs and autocorrelation
- 2005Weekday FX turning points and close run tests
- 2013Constructing a runs-test turn forecast
- 2017Star rating from slope and swing runs
- 2018Regime-dependent odds after directional price runs