1987issue C091-12
Evaluating money-supply serial dependence before a forecast
A historical monthly M2 example recodes a series into sign runs and magnitude classes, scores lagged transition matrices against independence, and reads triggered waiting-time histograms before the series is treated as a forecast input.
- Recode adjacent observations as a plus-or-minus sequence, assemble those signs into lagged transition matrices, and compare each matrix with an independence baseline using a chi-square statistic.
- Repeat the lag scan with three value-change classes so large declines, mid-range moves, and large advances can be tracked as discrete states.
- Build triggered waiting-time histograms that count how many sampling intervals elapse from one selected state until a specified later state appears, and compare those counts with independence.
- When sign matrices, magnitude matrices, and waiting-time histograms all show serial dependence, a forecast model that treats the series as independent of its own past is misspecified.
A historical monthly money-supply workflow
The worked example used monthly money-supply (M2) observations from 1948 to 1978. The same independence tests were presented as applicable to any consistent, continuous price series.
Sign runs and lagged transition matrices
The first procedure recodes adjacent observations as a plus-or-minus sequence and assembles those signs into lagged transition matrices. That recoding is a runs test, a check of whether up or down sign runs behave like independent flips. Each transition matrix is a frequency table of how often each coded state is followed by each other state, scored against the table expected under independence with a chi-square baseline that measures how far the observed table departs from independent successive changes.
The lag scan is an autocorrelation test: earlier states are paired with later states at widening spacings to see whether dependence fades as the interval lengthens. Lag-12 and lag-24 relative-change transition matrices were reported as statistically significant versus independence, indicating sequential money-supply changes remained dependent for at least 24 months.
Value-change classes at several lags
The second procedure bins adjacent M2 changes into three value-change classes, meaning three magnitude bins of adjacent period-to-period changes, so large declines, mid-range moves, and large advances can be tracked as discrete states. The stated ranges were -5.8 to +0.1, +0.2 to +1.3, and +1.4 to +6.2 billion dollars. Those class labels are then fed into lagged transition matrices.
Magnitude-class transition matrices rejected independence at lag 2, approached significance at lags 12 and 24, and were not significant at lag 36. That pattern was described as dependence lasting about two years but not three.
Triggered waiting-time histograms
A triggered waiting-time histogram counts how many sampling intervals elapse from one selected state until a specified later state appears. For large increases (class 3), the next class-3 event was placed most often in the following month. Omitting one intervening class 3 shifted the mode to the third through fifth later months. Omitting nine intervening class-3 events shifted peaks to about the 12th and 17th later months.
Histograms that start at the first month of the year and collect the first later class-1 or class-3 change concentrated those extremes at the start of the year and were described as statistically significant.
After a class-3 increase, the first later class-1 decrease used once each was most frequent at 25 to 27 months. Under independence the chance of a decrease in any given month of a 27-month window would be 0.014, versus observed values of 0.135, 0.176, and 0.243 at months 25, 26, and 27.
Waiting time to the next class-1 M2 change
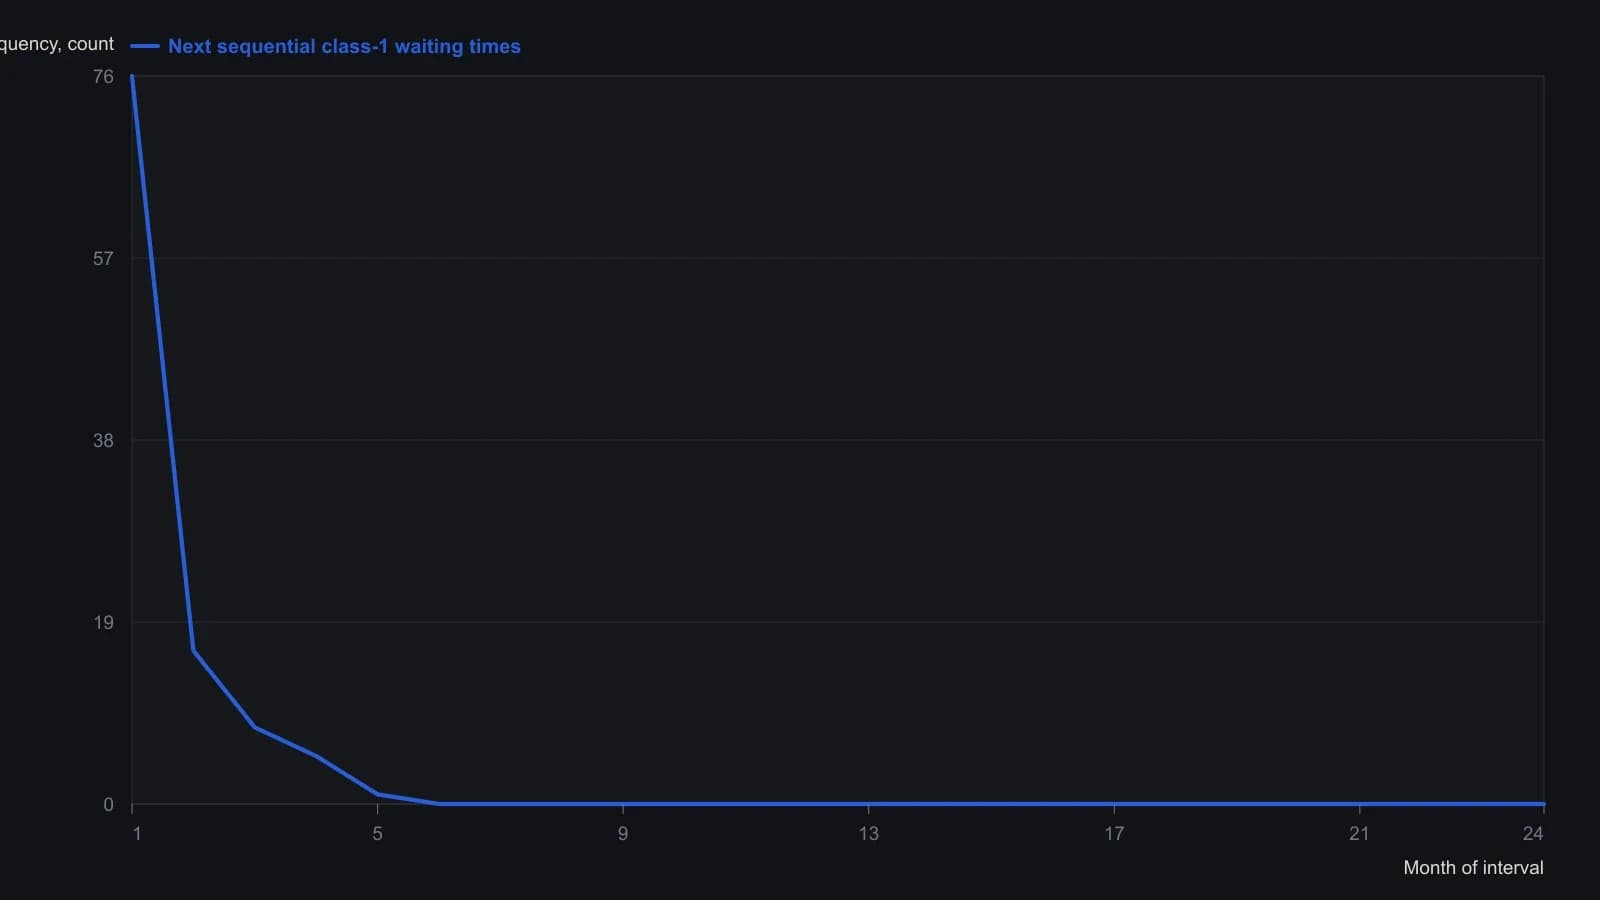
Class 1 is the lower third of adjacent monthly M2 changes on the 1948–1978 sample: −5.8 to +0.1 billion dollars. Bars are approximate because they were read from a low-contrast inverted scan.
What the three checks jointly imply
Serial dependence is a departure from independence in which earlier observations in an ordered series systematically influence later observations. Across the sign matrices, magnitude matrices, and triggered waiting-time histograms, the M2 series was judged to contain serial dependence, so a forecast model that treats the series as independent of its own past would be misspecified.
All readings on this track · 6 readings
- 1985A serial-dependence window from signed price transitions
- 1986Chi-square tests on price transition matrices
- 1987Evaluating money-supply serial dependence before a forecast
- 1988Evaluating stationarity, randomness, and dependence in an index series
- 1993Constructing price-change Markov transition matrices
- 1995Collapse correlated inputs via a joint-state chi-square sequence