1994issue C111-13
Extreme short-rate declines as equity regime context
A three-step regime check places one equity idea on the short-rate intermarket, grades that rate move against same-length historical analogs, and asks whether the easing is an early print or a late-cycle echo.
- The archive treated short-rate moves and equity prices as inversely related, with a lagged-equity-response over later days, weeks, or months rather than on the session of the rate change.
- An extremes-threshold flagged only falling rates, and a smoothed-yield-path kept a one-day spike from defining a multi-day extreme.
- Historical-analog-comparison contrasted later equity outcomes after rare yield declines with the unconditional sample for the same horizon.
- Seasonality-analysis read each flag inside a rate-cycle-cluster and treated the first print as more informative than later repeats.
A regime check around one equity idea
An equity thesis can look complete on its own price series and still lack a rate context. Intermarket-analysis reads that equity risk through a contemporaneous move in short-term yields rather than through the equity series alone.
The archive treated short-rate moves and equity prices as inversely related. The lagged-equity-response arrived over later days, weeks, or months rather than on the day of the rate change. Two channels motivated that inverse link: rate moves alter financing costs and earnings expectations, and they shift substitution between equities and debt as relative expected returns change.
Place the move on the intermarket
The paired series were daily three-month Treasury bill secondary-market yields and daily S&P 500 closes. When the Treasury market was closed, the prior bill yield was carried forward. Equity changes were measured as non-annualized geometric returns.
A smoothed-yield-path, a short exponential average of two weeks or less, was applied to bill yields before any extreme was classified. The archive argued that this modest smoother made multi-day readings more stable than raw daily spikes.
Grade the move against historical analogs
Historical-analog-comparison sorts past windows by how rare a rate change was, then contrasts later equity outcomes in those windows with the unconditional sample for the same horizon.
Rate declines were grouped on several lookbacks from a few sessions to a few months. Subsequent S&P 500 outcomes after the rarest prior yield declines were tabulated across several forecast horizons and compared with the sample-wide baselines for the same market.
Lengthening the rate-change window was described as reducing the chance of a large later equity decline more reliably than it raised the typical outcome. A medium multi-week change was the default monitor. A longer window was framed as a downside-filter tradeoff.
Ask where the easing sits in the cycle
An extremes-threshold is a one-sided tail rule. It flags a rate change only when the decline sits in the outer 1 percent, 2 percent, or 5 percent of the historical decline distribution. The rule was applied only to falling rates, not to both tails.
Seasonality-analysis places a rate-extreme episode in a multi-week easing cycle: whether it is a first print, a repeat in a cluster, or a late-cycle echo. On the default monitor, the broader tail declines arrived infrequently and in clusters. They tended to show up in the later stage of a declining-rate cycle. That pattern is a rate-cycle-cluster. The first flag was treated as more informative than later repeats.
Extensions that keep the analog design
Suggested extensions kept the same analog design but changed the input: other points on the Treasury curve or credit yields, the speed of the rate change rather than only its size, and equity variability after sharp rate increases as well as after declines.
S&P 500 returns after extreme 5% T-bill yield declines
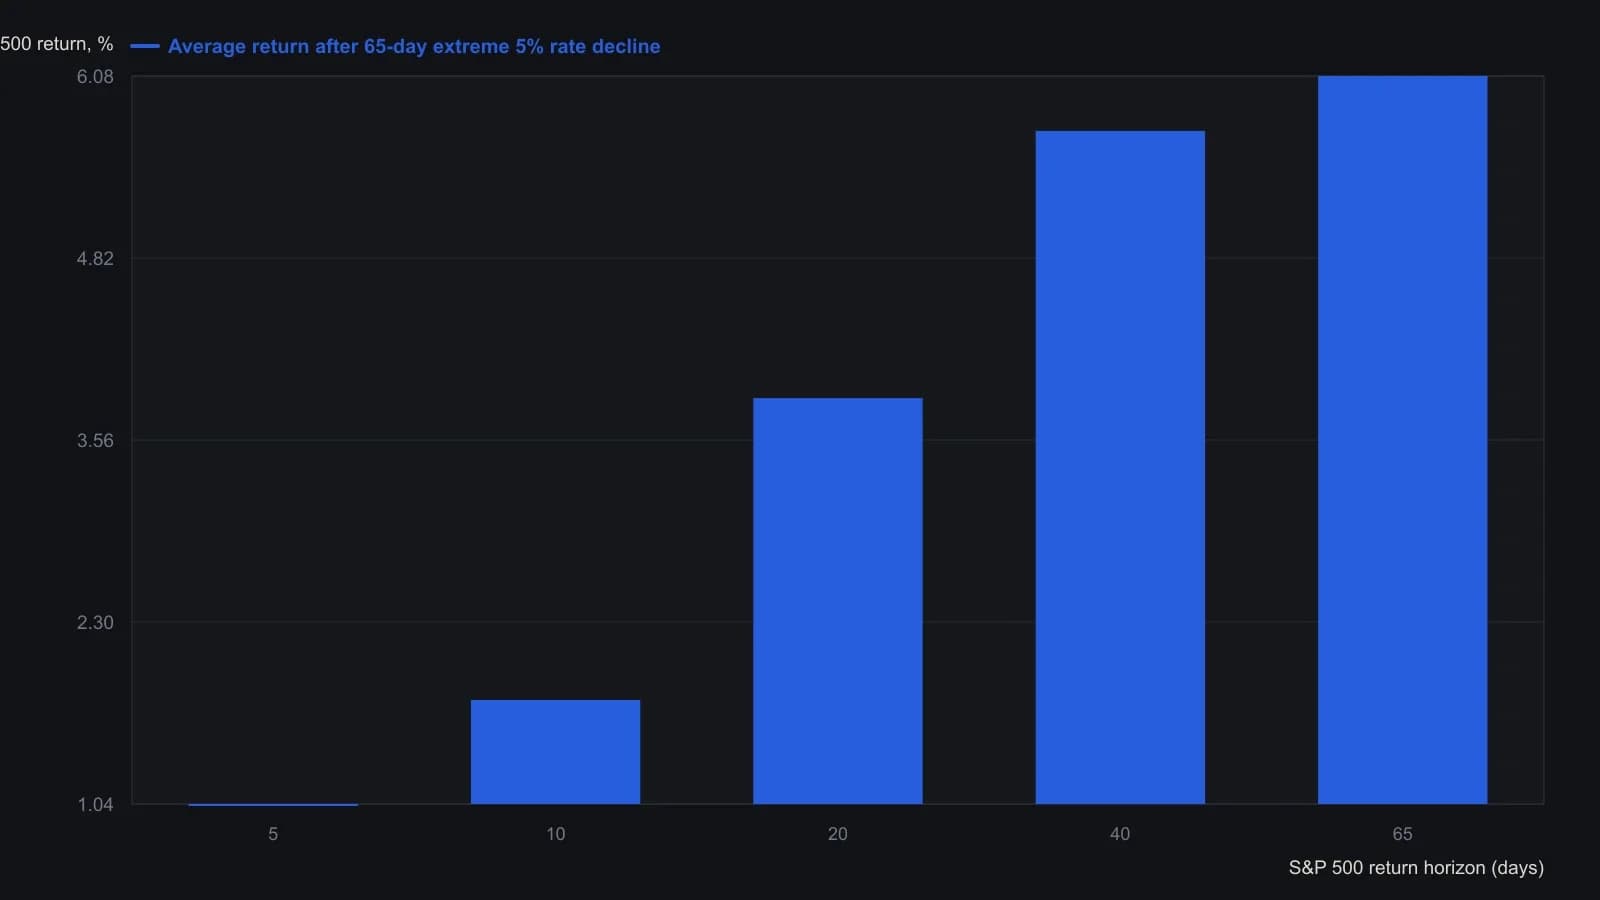
Rate series is the daily secondary-market three-month T-bill yield, smoothed with a 10-day EMA. Equity returns are geometric S&P 500 percentage changes, not annualized. Sample is about 5,000 trading days from March 1974 through 31 December 1993. Required decline is the threshold that puts the rate move in the extreme 5% of that lookback.
All readings on this track · 19 readings
- 1988Crash fear fails the depression regime test
- 1990October 1987 cycle overlay and the loss-trap
- 1990Constructing nested four-year market cycles
- 1991Evaluating quarterly return runs with historical analogs
- 1992Evaluating split events across correction and bear regimes
- 1993Mining-bullion relative strength as a gold-sleeve regime
- 1994A two-horizon case study of a market-breadth oscillator
- 1994Extreme short-rate declines as equity regime context
- 1997Clustered true-range days as a regime label rather than a top forecast
- 2001Nearest-neighbor one-week forecast from log-price patterns
- 2001Constructing nearest-neighbor forecasts gated by a trend filter
- 2003Regime context for debt-era bear rallies
- 2004Testing a 1987 stock and gold analog by wave degree
- 2004Shifting calendar regimes and election-cycle analogs
- 2006Aligning sugar boom phases with seasonal analogs
- 2009Crowd consensus and failed targets as regime context
- 2011Treat a long-horizon chart analog as a regime scenario
- 2012Build a weekly analog as a dated forecast object
- 2015From a drawn price shape to an event-cloud case study