1992issue C071-6
Evaluating split events across correction and bear regimes
A four-year review of stock-split dates scored prices three months before the effective date and three and six months after it, including years with a severe-correction or a bear-market. The more consistent analog pattern was a rise before the split became effective, not reliable strength in the post-split-window.
- A stock-split halves the quoted price and the per-share earnings and dividends while doubling the share count, without increasing the issuer's financial strength.
- Event-driven-context locates the effective date inside the market-regime, including severe-correction and bear-market years when split activity looked heavier.
- Historical-analog-comparison of the post-split-window was not uniformly positive at three and six months, contrary to the belief that the event itself is a short-horizon lift.
- The most consistent analog pattern was a rise before the split became effective. Later six-month paths were described as more dependent on earnings, other corporate actions, market performance, and economic change.
What a stock-split changes
A two-for-one stock-split halves the quoted price and the per-share earnings and dividends while doubling the share count. The recapitalization does not increase the issuer's financial strength.
The date therefore changes the scale of the quote, not the economic position of the issuer.
Place the date inside the market-regime
Split activity looked heavier in years that contained a severe-correction, defined as a drop of 150 points or more in the industrial average, or a bear-market, defined as a drop of 20 percent or more. In this review a single-session break was also counted as a bear episode.
Nearly half of the 1987 splits in the sample arrived after the late-summer peak or after the October break. The review treated those later announcements as attempts to support falling prices.
Stock-split counts in correction years versus quieter years
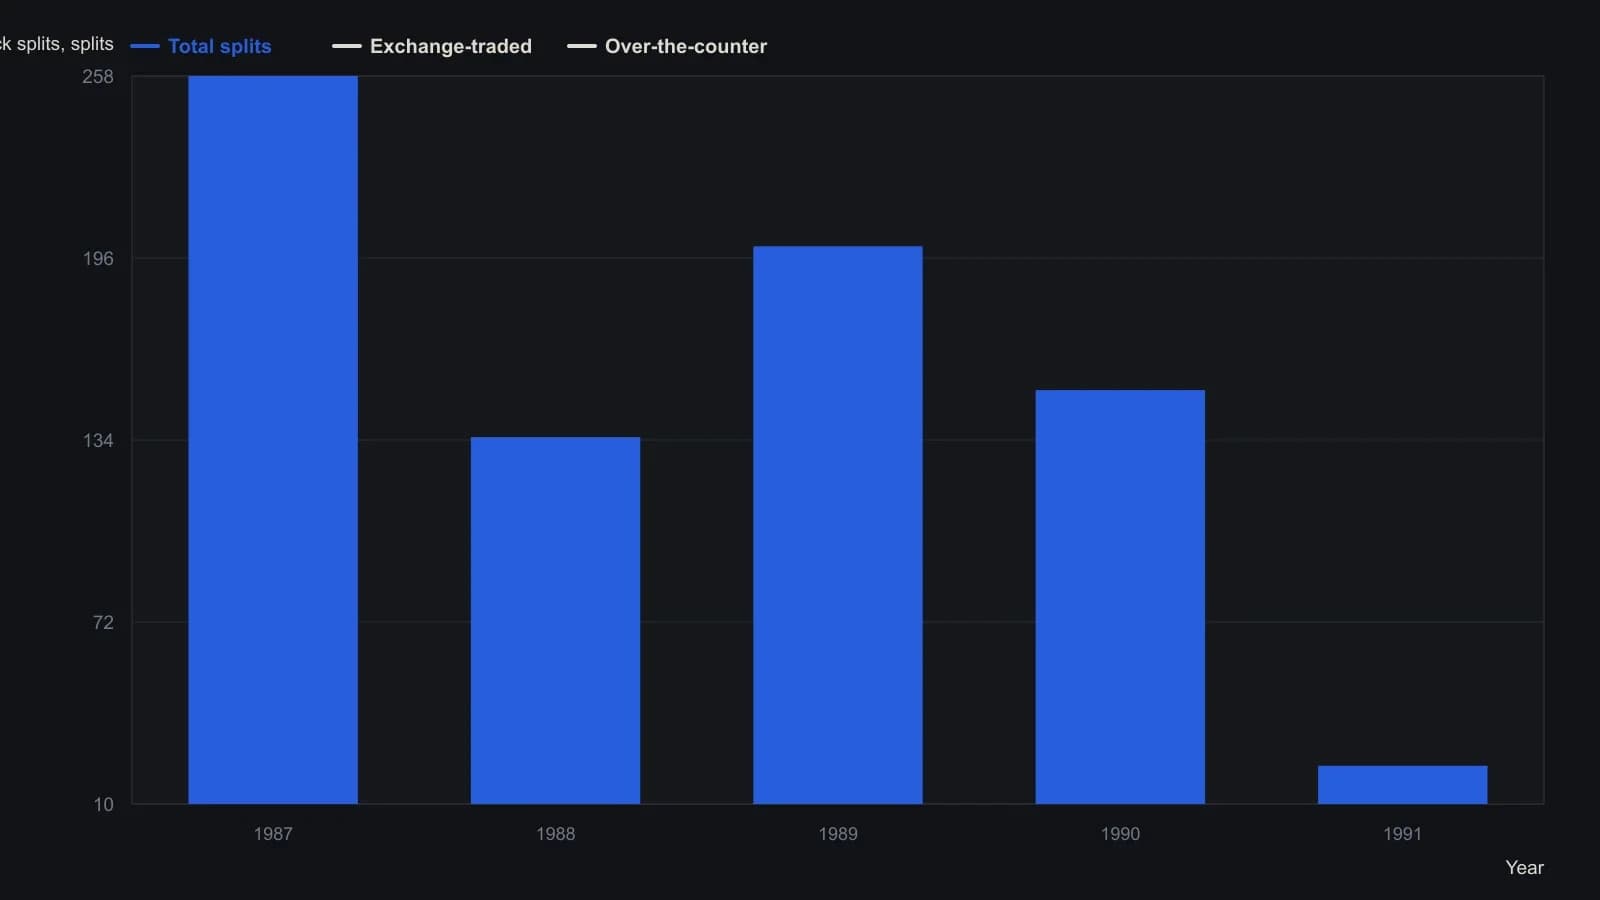
The source marks 1987, 1989 and 1990 with an asterisk as years that had a severe correction or a bear market. The study window is April 1987 through April 1991, so 1991 covers only the first months of the year.
Keep the analog on one clock
A four-year review from April 1987 through April 1991 scored exchange-listed and over-the-counter split stocks three months before the effective date and three and six months after it. Unchanged prices counted as no gain.
Exchange-listed names were usually lower three months before the split than at the effective date. The 1987 over-the-counter names were about evenly split on that pre-event comparison.
What the post-split-window showed
After the 1987 splits, only about half of the names were higher three months later, and a majority were lower six months later.
The 1988 and 1989 post-split-window results leaned only modestly higher at both three and six months. The 1990 bear-market year did not favor those same intervals.
Across the sample, three- and six-month results after splits were not uniformly positive, contrary to the common belief that the event itself is a short-horizon lift.
Six-month paths after a split were described as more dependent on earnings, other corporate actions, market performance, and economic change than on the split itself. The most consistent pattern in the analog was a rise before the split became effective, not reliable strength in the following three- to six-month window.
All readings on this track · 19 readings
- 1988Crash fear fails the depression regime test
- 1990October 1987 cycle overlay and the loss-trap
- 1990Constructing nested four-year market cycles
- 1991Evaluating quarterly return runs with historical analogs
- 1992Evaluating split events across correction and bear regimes
- 1993Mining-bullion relative strength as a gold-sleeve regime
- 1994A two-horizon case study of a market-breadth oscillator
- 1994Extreme short-rate declines as equity regime context
- 1997Clustered true-range days as a regime label rather than a top forecast
- 2001Nearest-neighbor one-week forecast from log-price patterns
- 2001Constructing nearest-neighbor forecasts gated by a trend filter
- 2003Regime context for debt-era bear rallies
- 2004Testing a 1987 stock and gold analog by wave degree
- 2004Shifting calendar regimes and election-cycle analogs
- 2006Aligning sugar boom phases with seasonal analogs
- 2009Crowd consensus and failed targets as regime context
- 2011Treat a long-horizon chart analog as a regime scenario
- 2012Build a weekly analog as a dated forecast object
- 2015From a drawn price shape to an event-cloud case study